
Thống kê Sinh học Cơ bản và Lâm sàng, Ấn bản thứ 5 – Basic & Clinical Biostatistics, 5e
Tác giả: Susan White – Nhà xuất bản McGraw-Hill Medical – Biên dịch: Ths.Bs. Lê Đình Sáng
Phụ lục C: Các lưu đồ liên kết câu hỏi nghiên cứu với phương pháp thống kê
Bảng sau đây chỉ dẫn cách sử dụng các lưu đồ:
| Lưu đồ | Câu hỏi nghiên cứu |
|---|---|
| Lưu đồ C-1 | Có sự khác biệt về giá trị trung bình (means) hoặc trung vị (medians) đối với các thước đo thứ tự (ordinal measures) hoặc số trị (numerical measures) hay không? |
| Lưu đồ C-2 | Có sự khác biệt về giá trị trung bình hoặc trung vị đối với các thước đo thứ tự hoặc số trị, khi có từ ba nhóm trở lên hay không? |
| Lưu đồ C-3 | Có sự khác biệt về tỷ lệ (proportions) đối với các thước đo danh nghĩa (nominal measures) hay không? |
| Lưu đồ C-4 | Có mối liên hệ (association) nào không? |
| Lưu đồ C-5 | Có sự khác biệt về các thước đo mức độ liên hệ hay không? |
| Lưu đồ C-6 | Có từ hai biến độc lập (independent variables) trở lên hay không? |
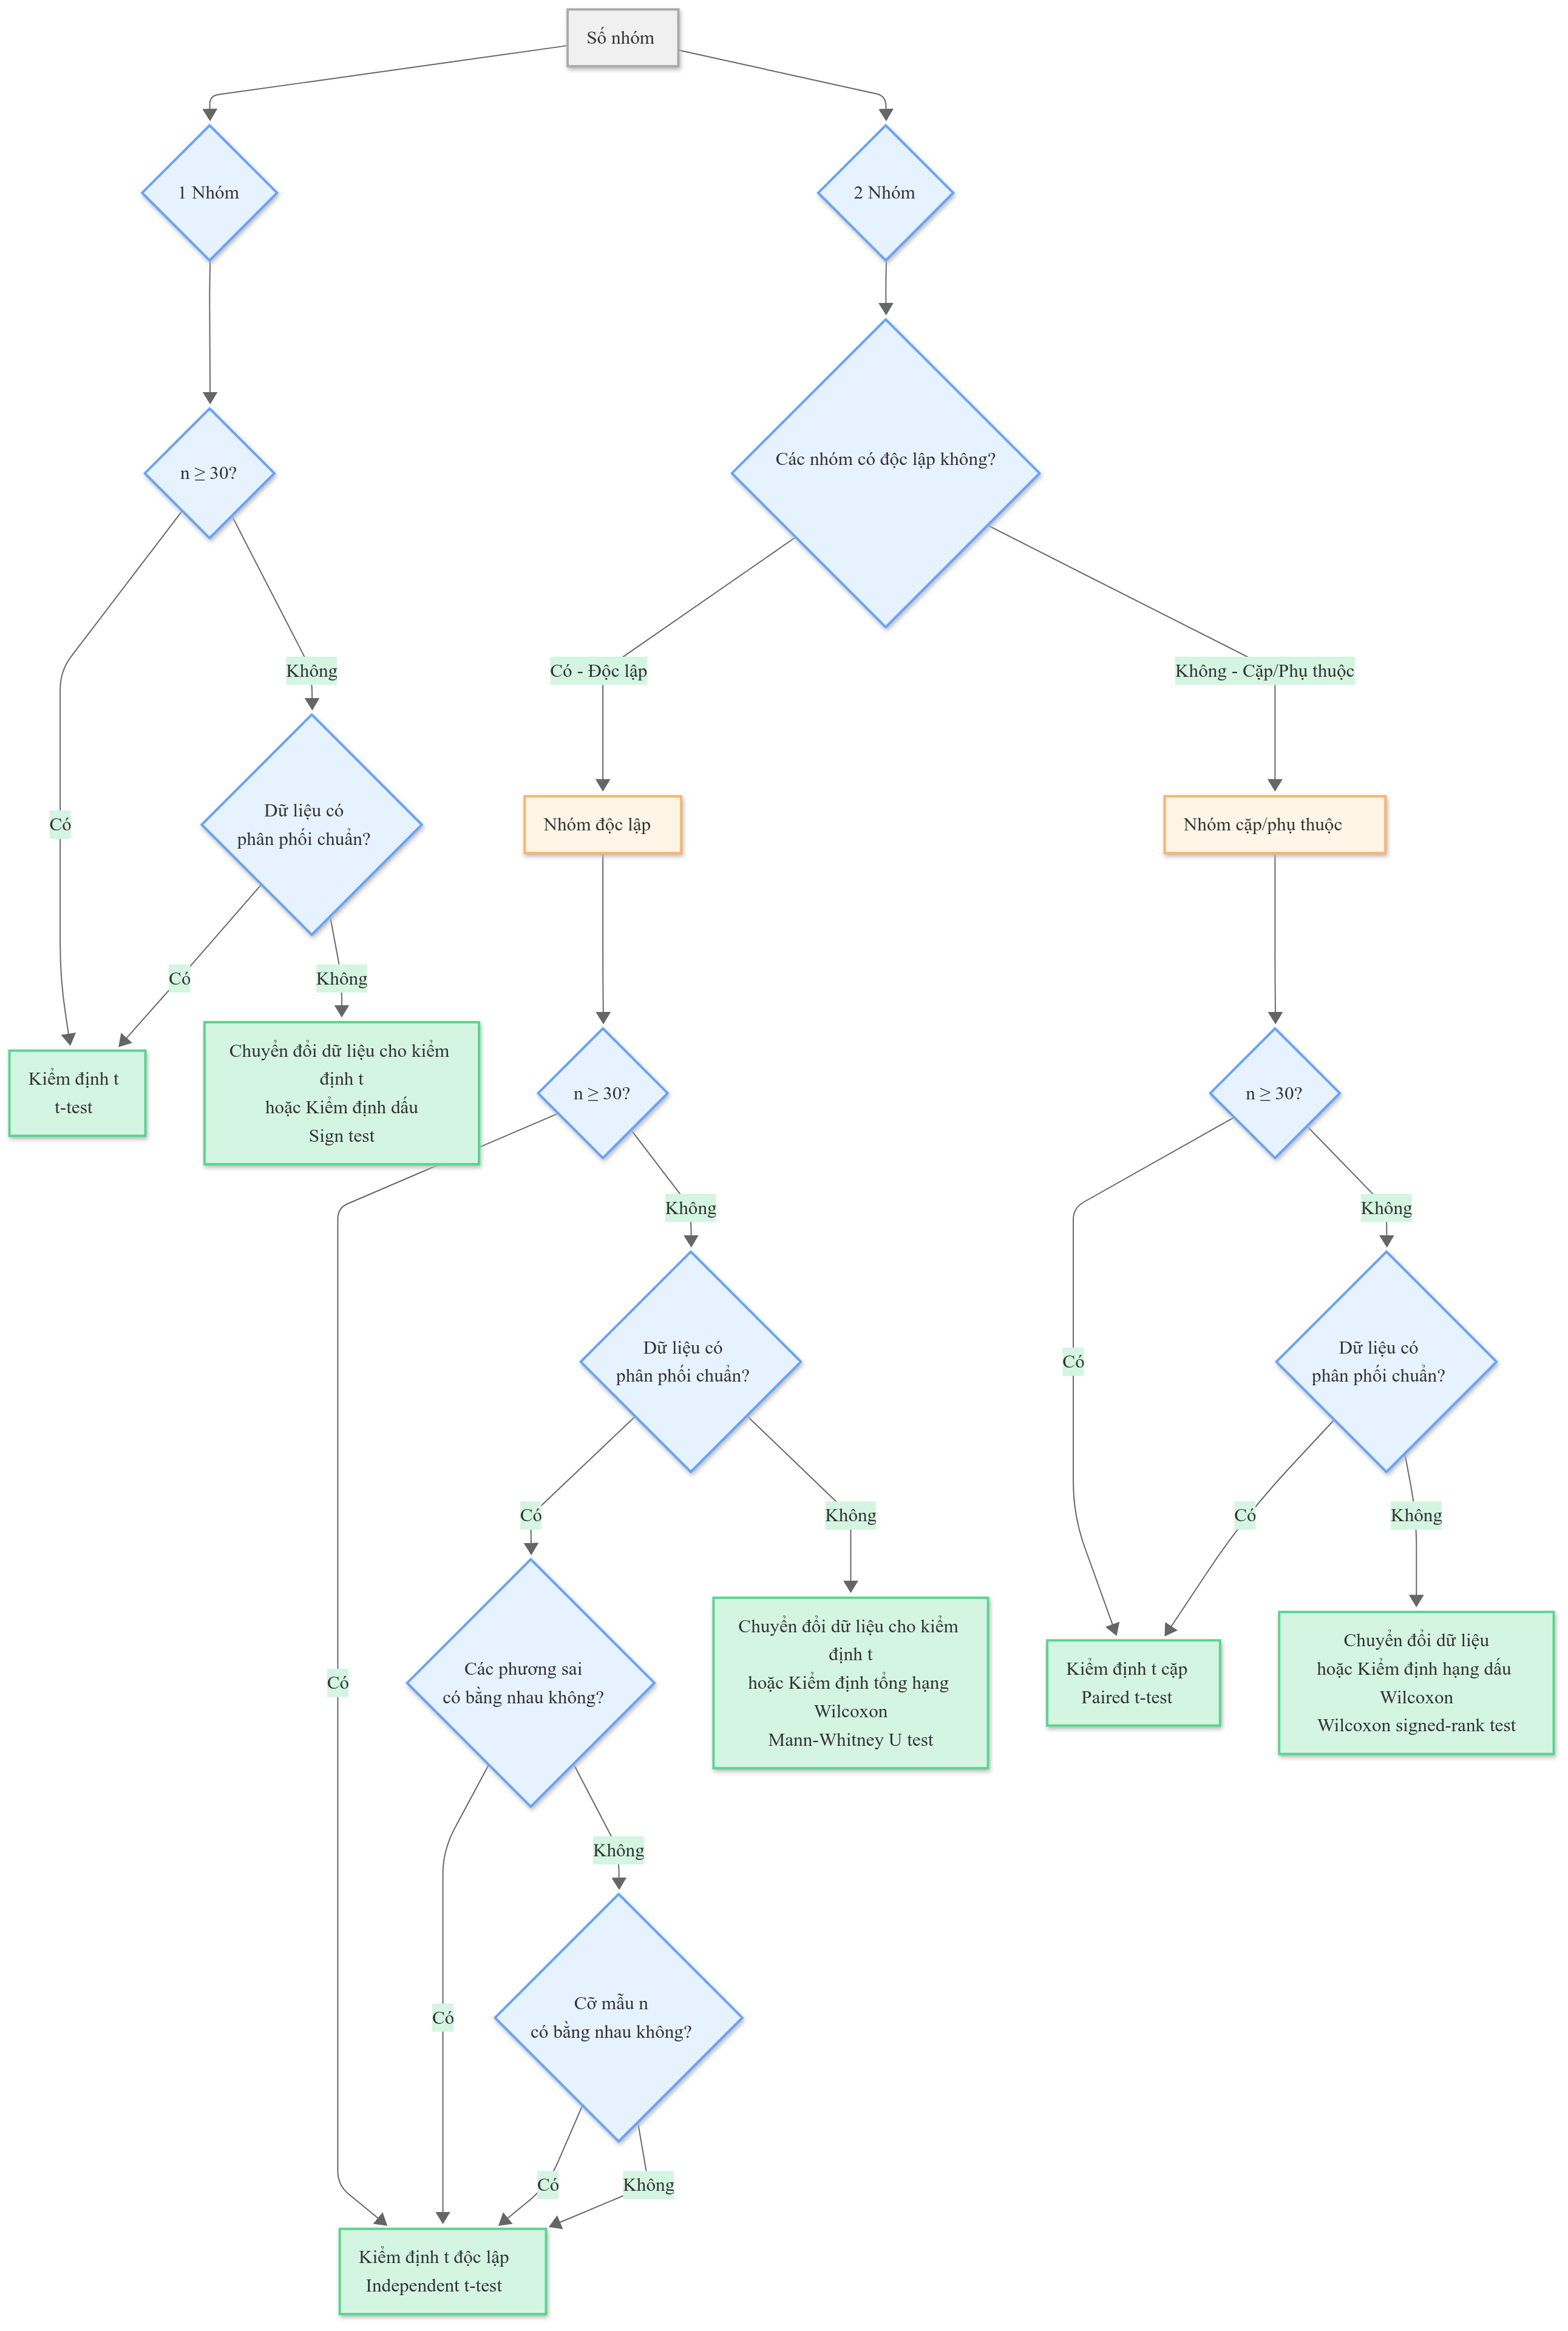
Lưu đồ C-1: Lựa chọn kiểm định thống kê cho 1 hoặc 2 nhóm
Sơ đồ phân tích câu hỏi: “Có sự khác biệt về giá trị trung bình hoặc trung vị đối với các thước đo thứ tự hoặc số trị hay không?”
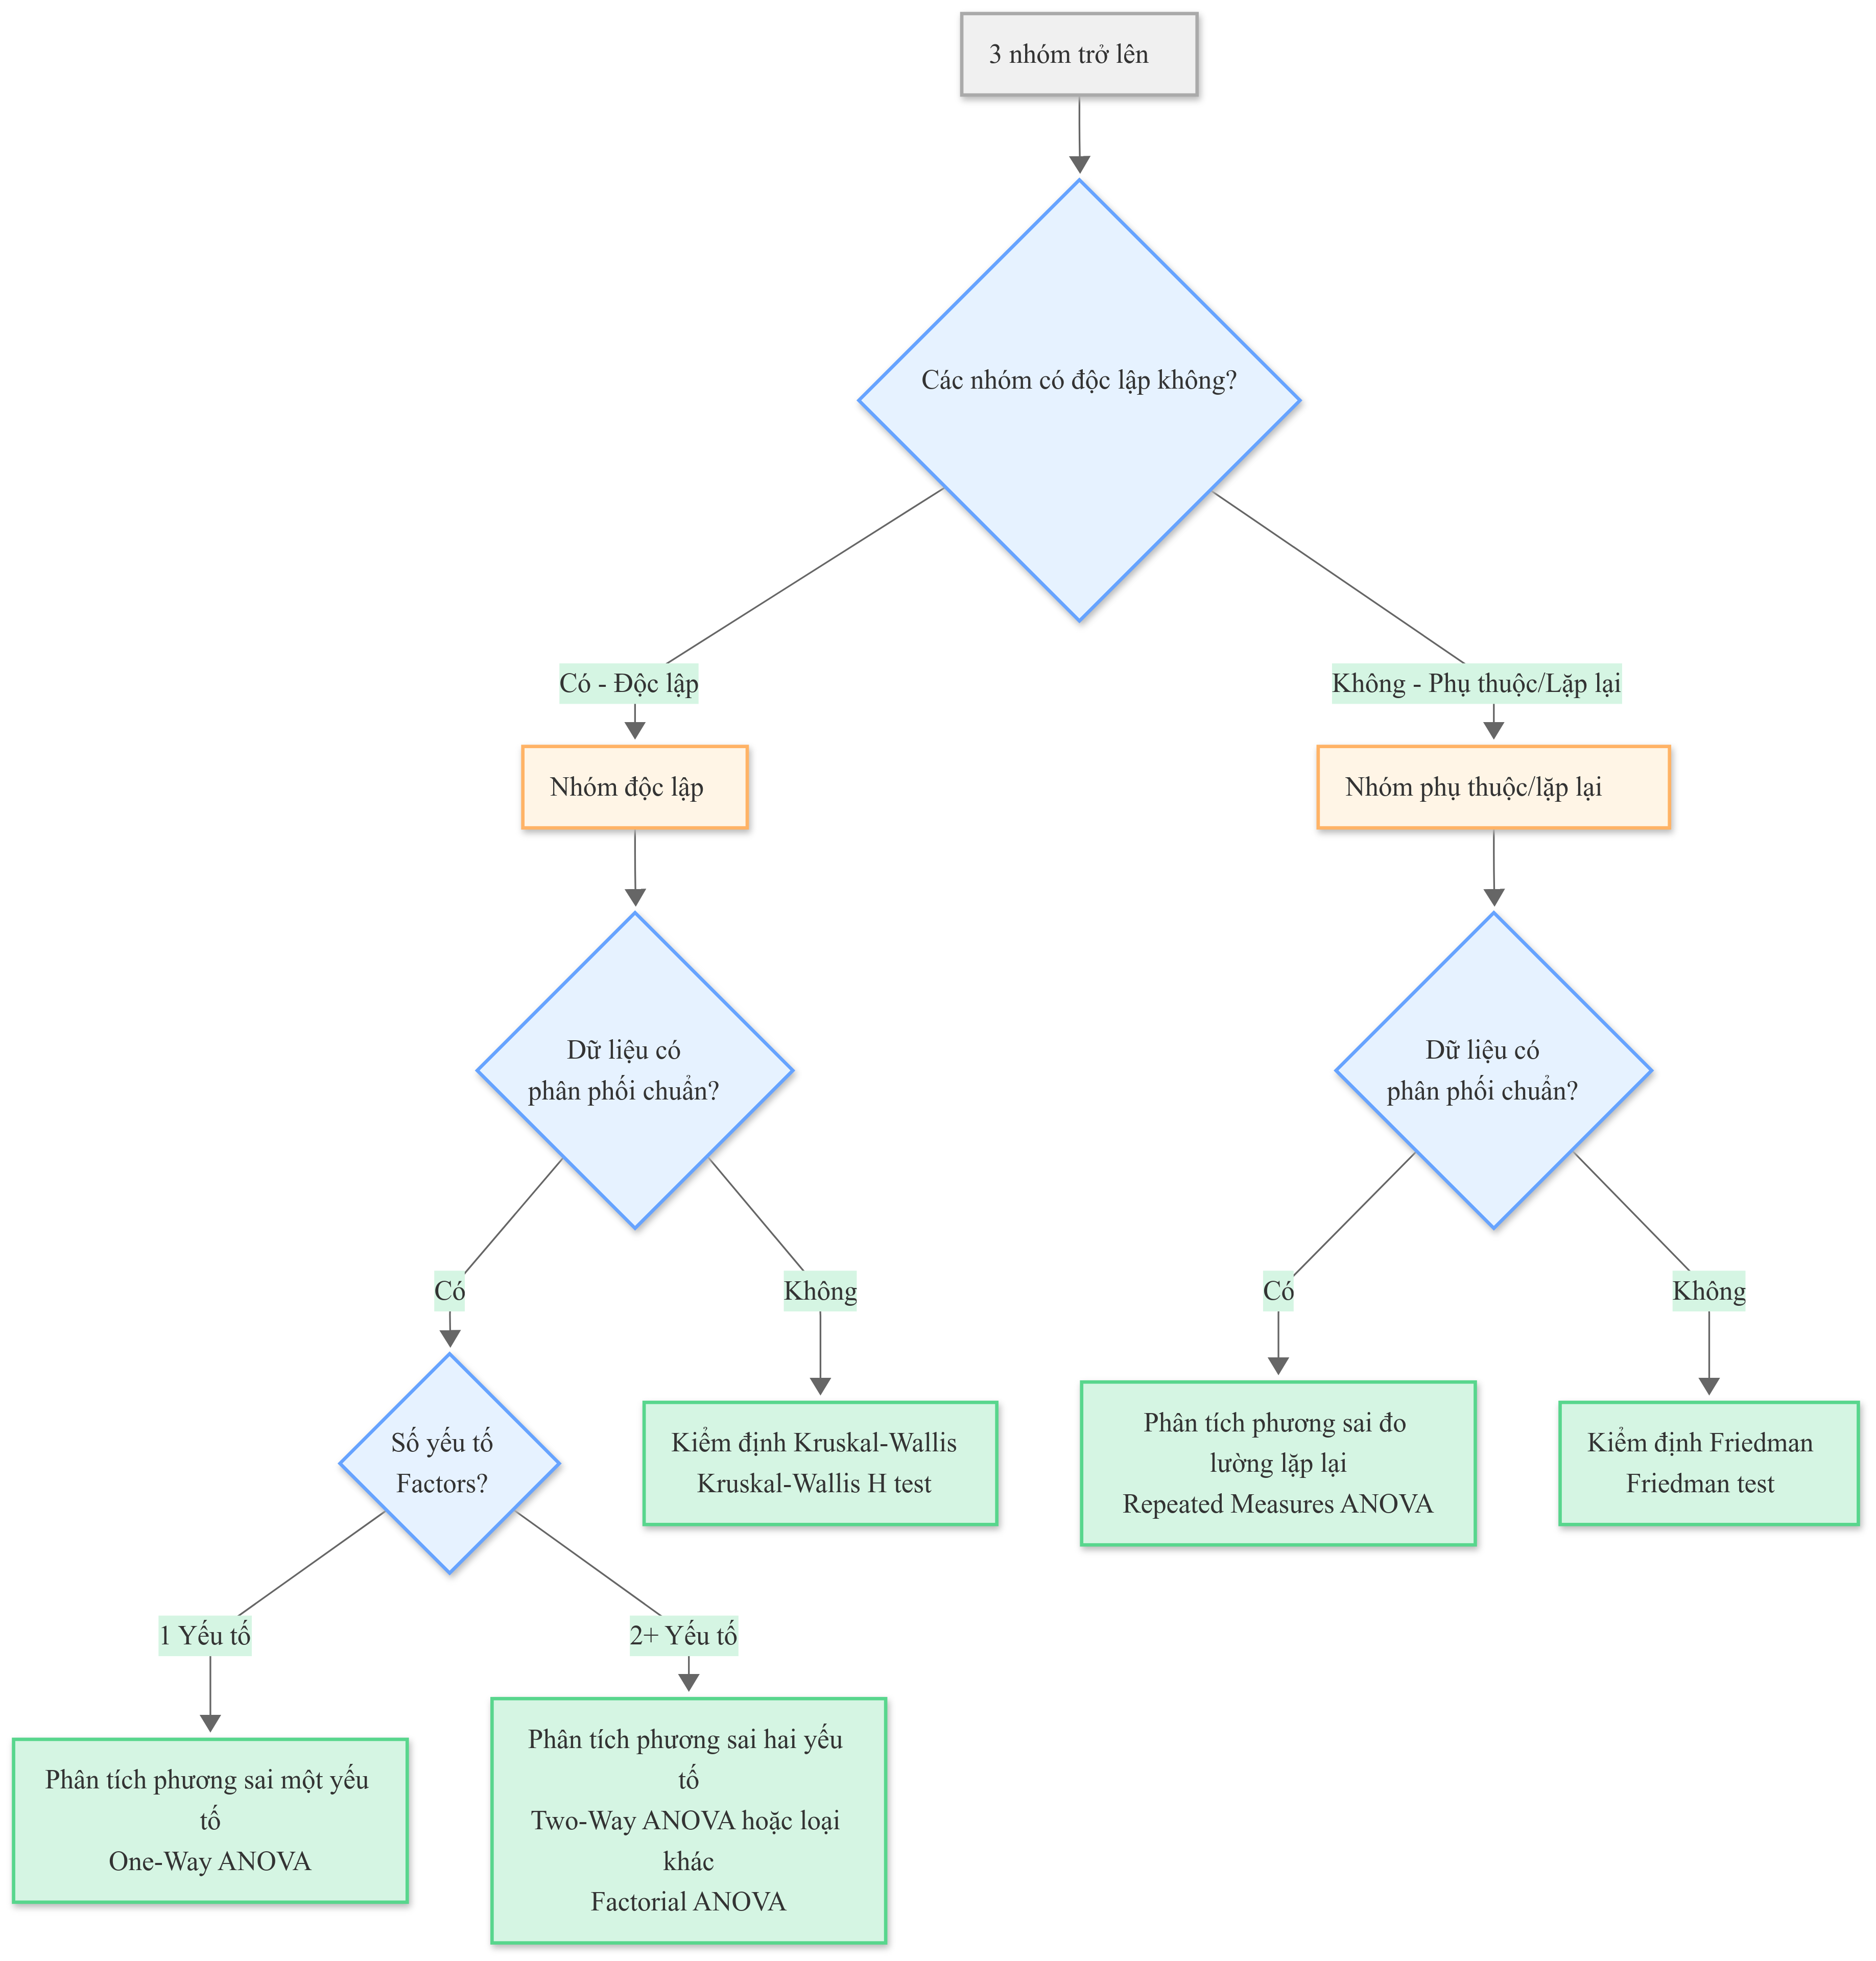
Lưu đồ C-2: Lựa chọn kiểm định thống kê cho 3 nhóm trở lên
Sơ đồ phân tích câu hỏi: “Có sự khác biệt về giá trị trung bình hoặc trung vị đối với các thước đo thứ tự hoặc số trị, khi có từ ba nhóm trở lên hay không?”
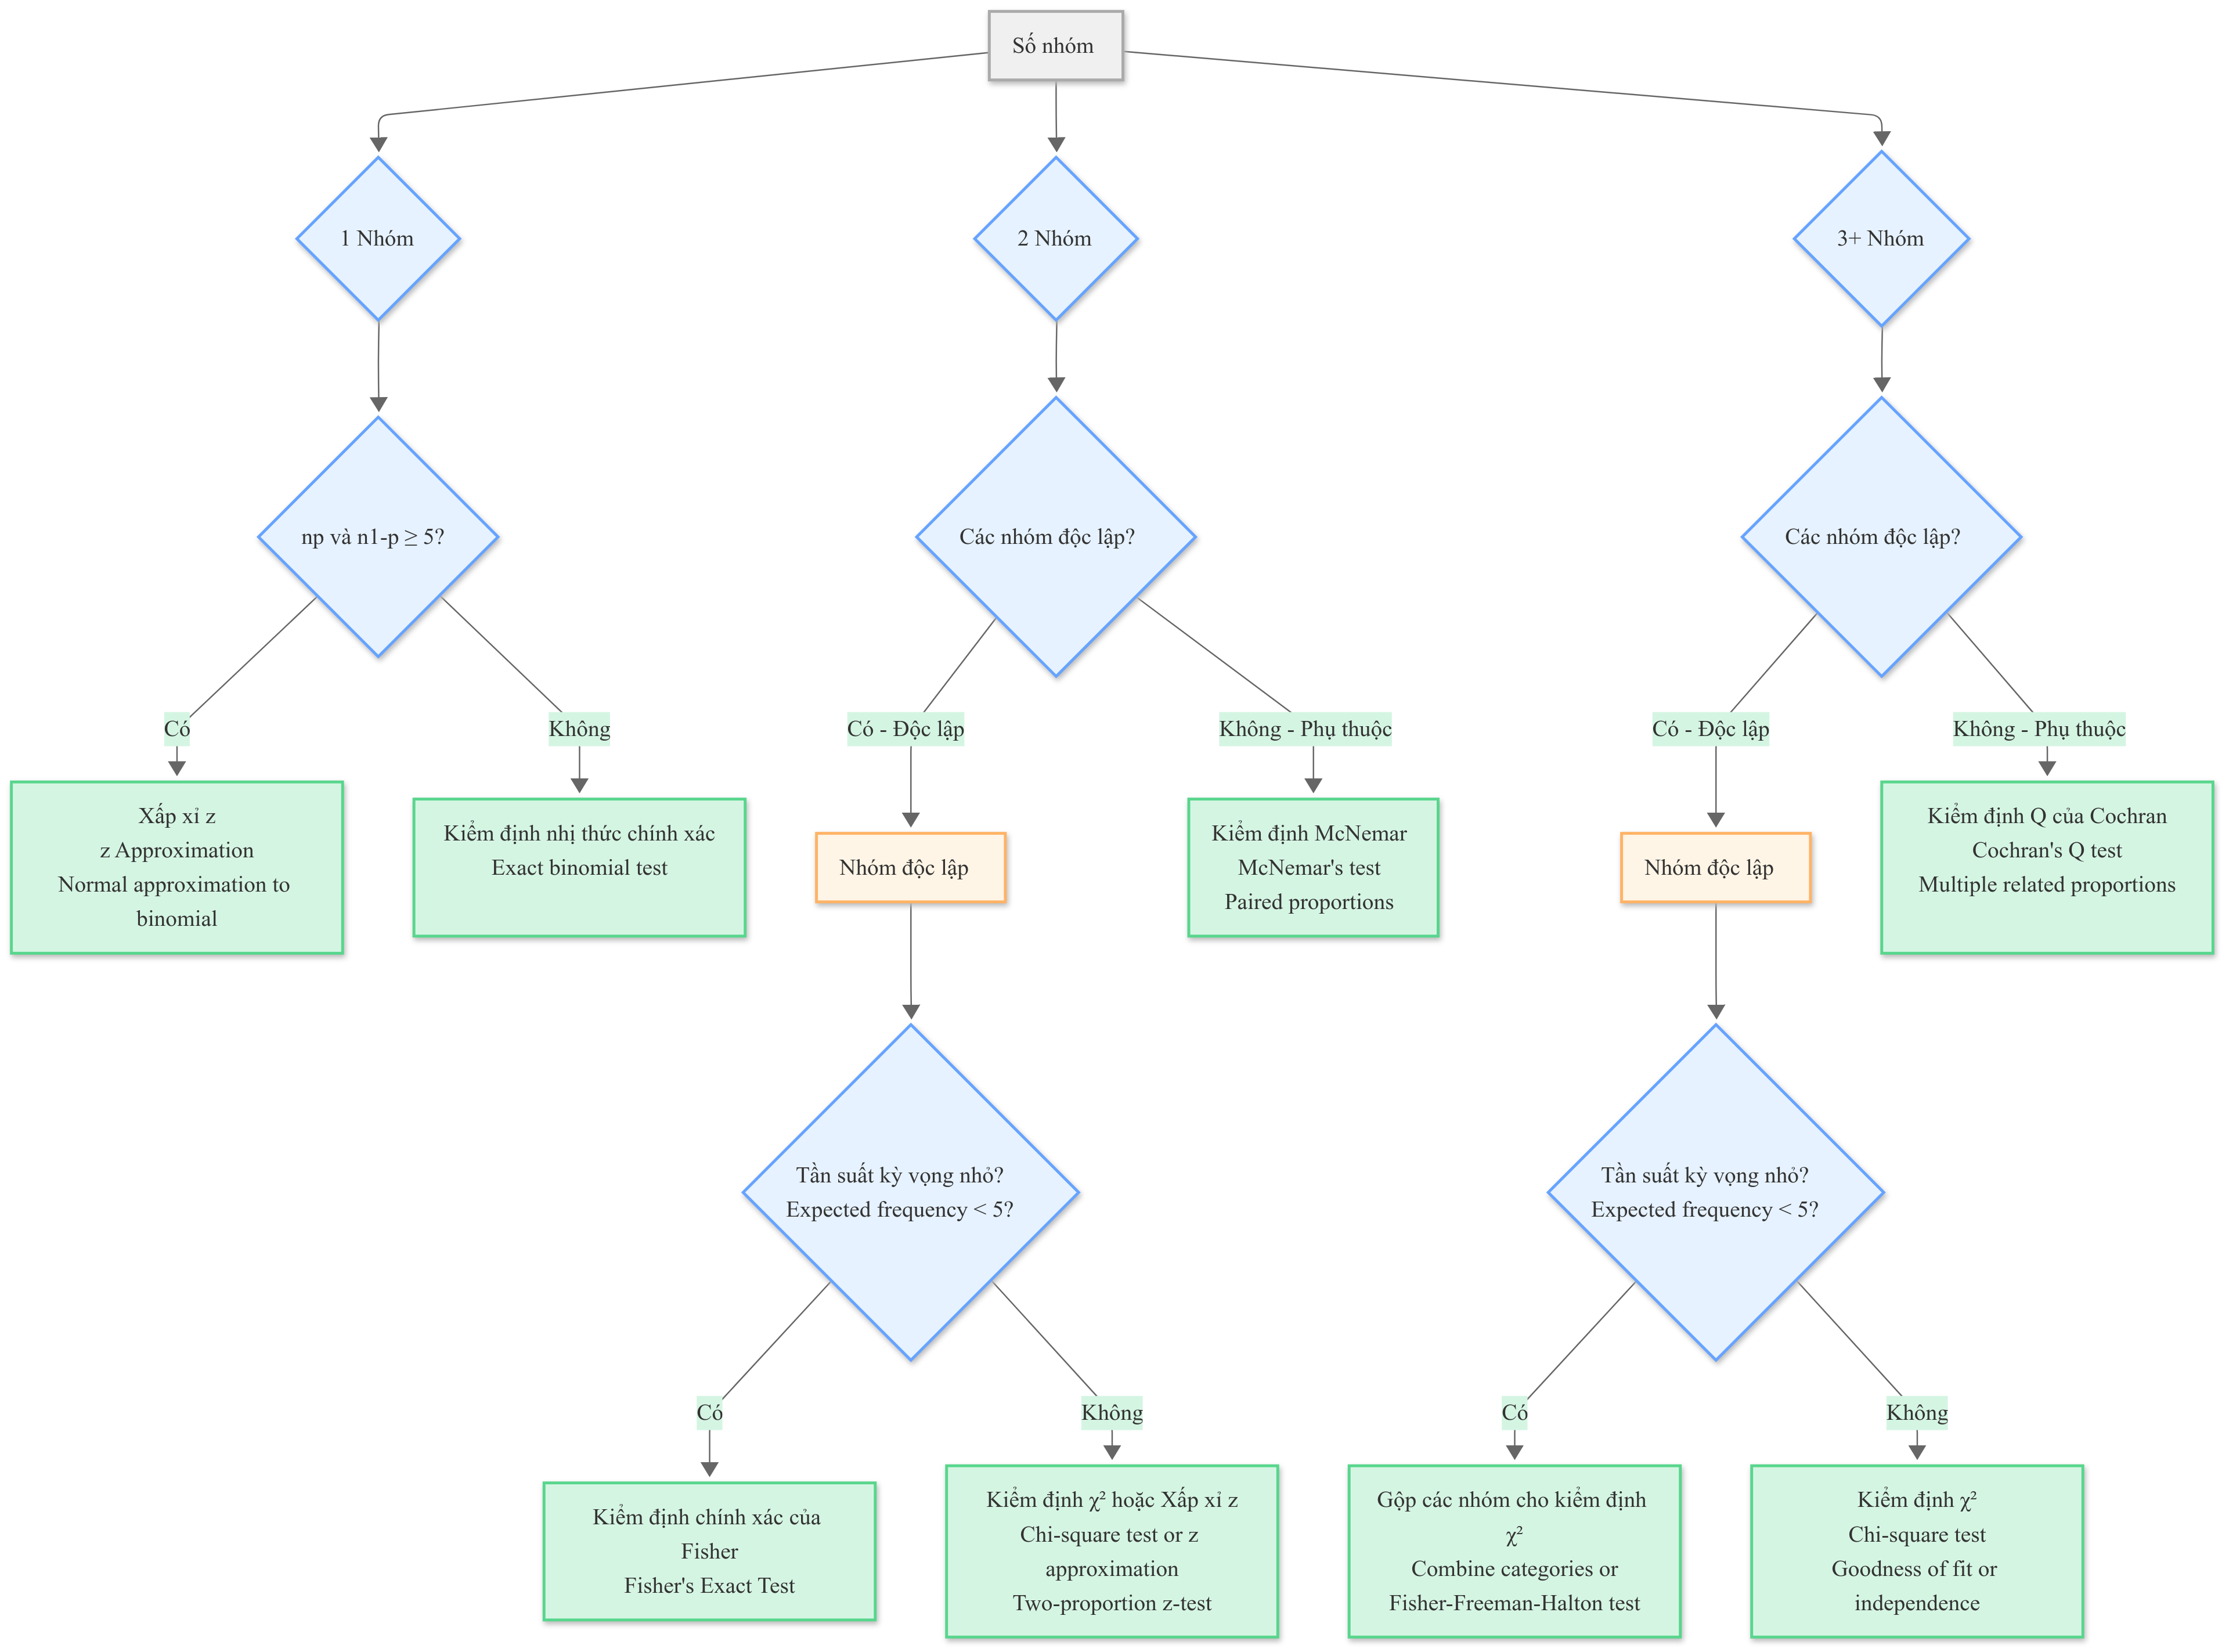
Lưu đồ C-3: Lựa chọn kiểm định so sánh tỷ lệ
Sơ đồ phân tích câu hỏi: “Có sự khác biệt về tỷ lệ đối với các thước đo danh nghĩa hay không?”
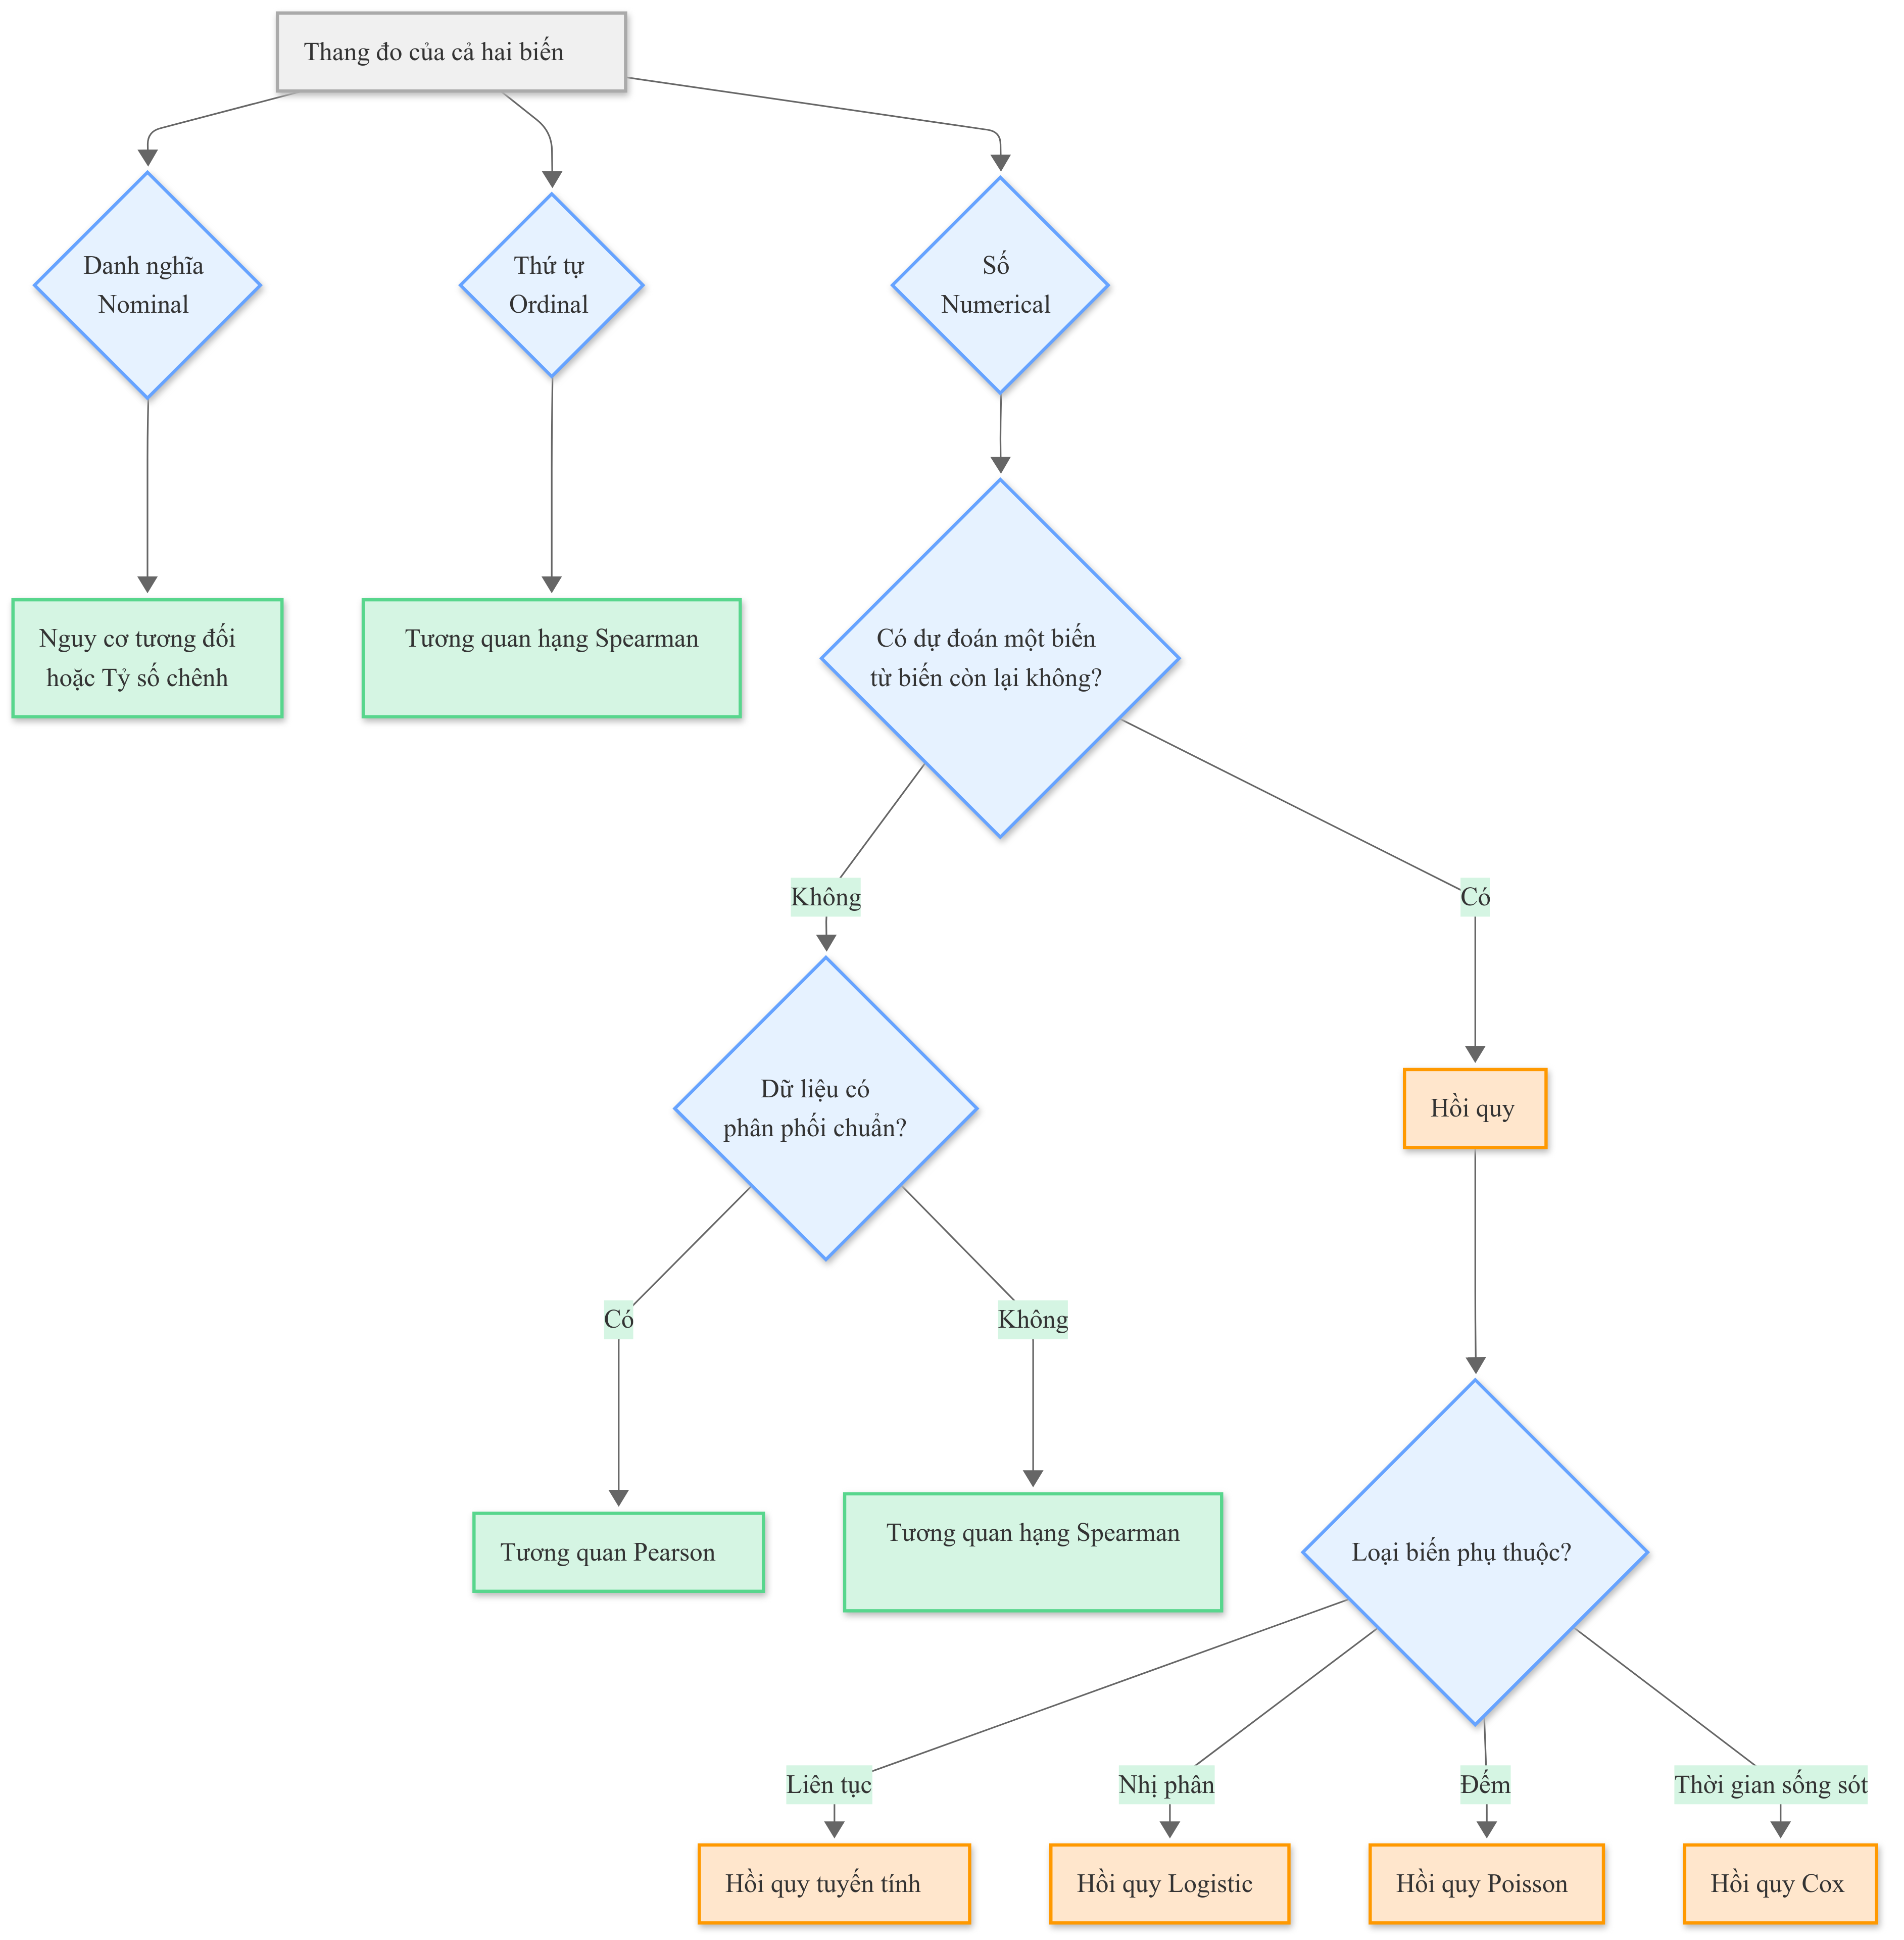
Lưu đồ C-4: Lựa chọn phương pháp phân tích mối liên hệ
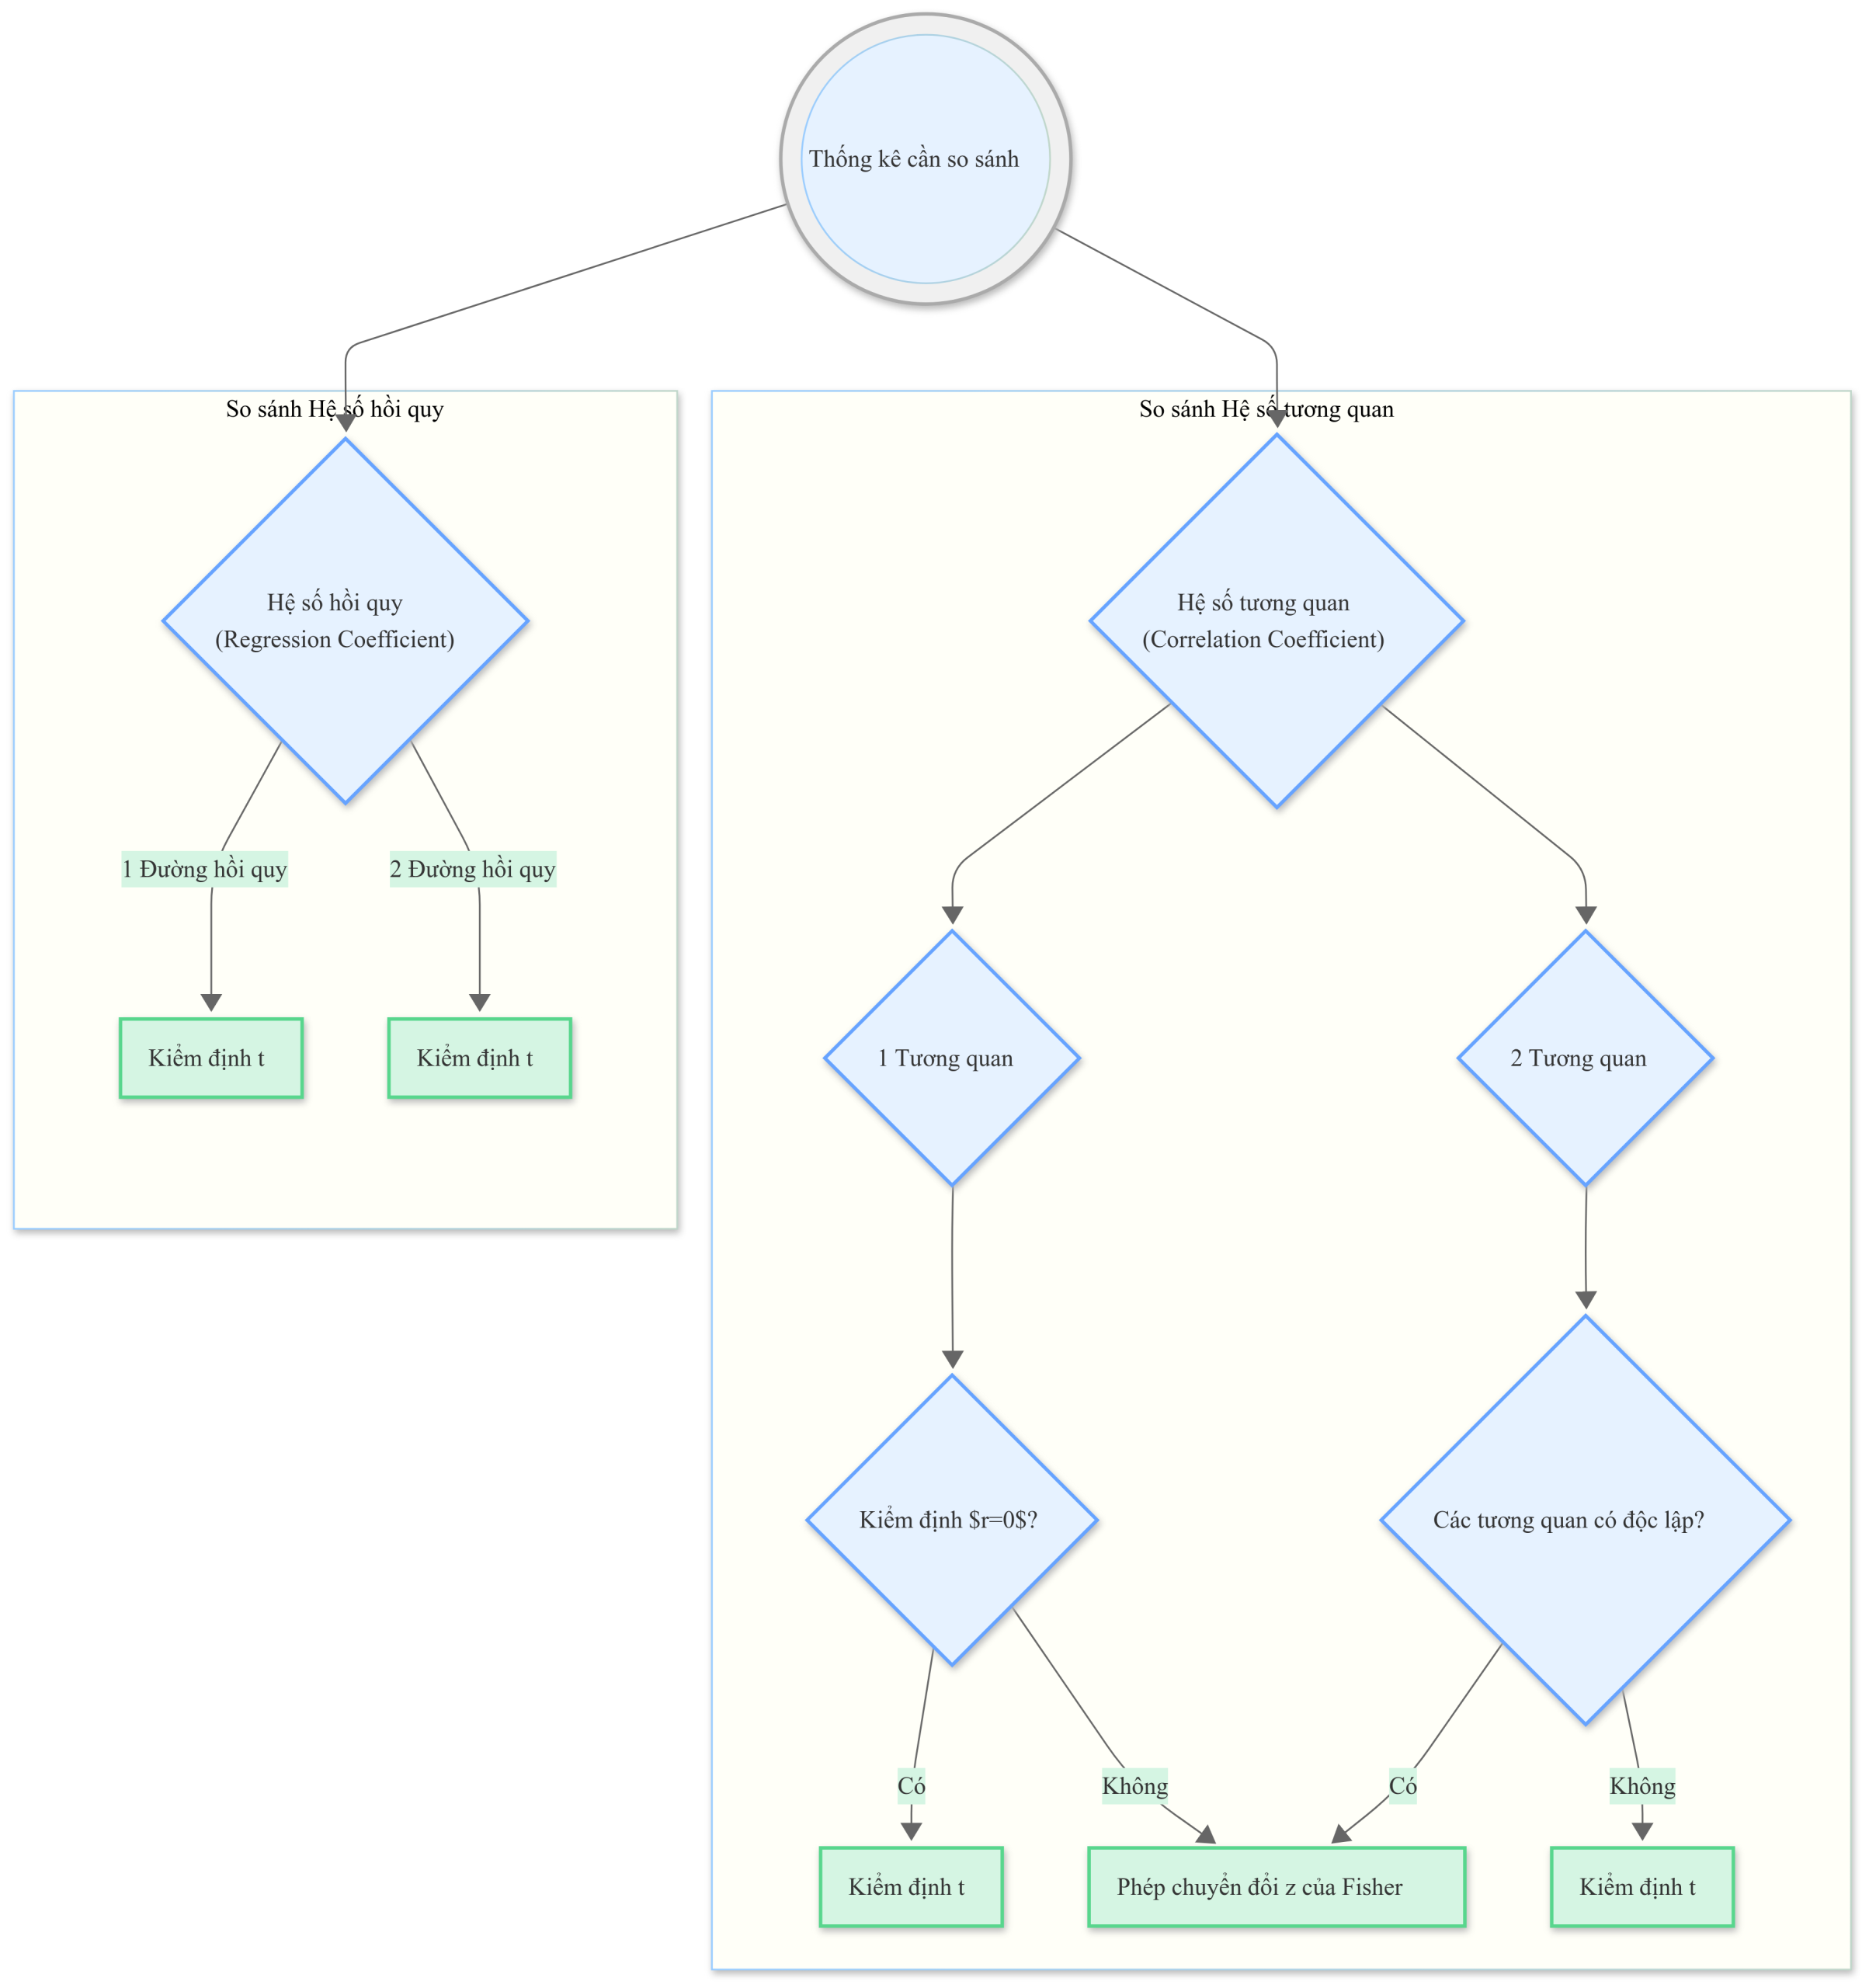
Lưu đồ C-5: Lựa chọn kiểm định so sánh các thước đo liên hệ
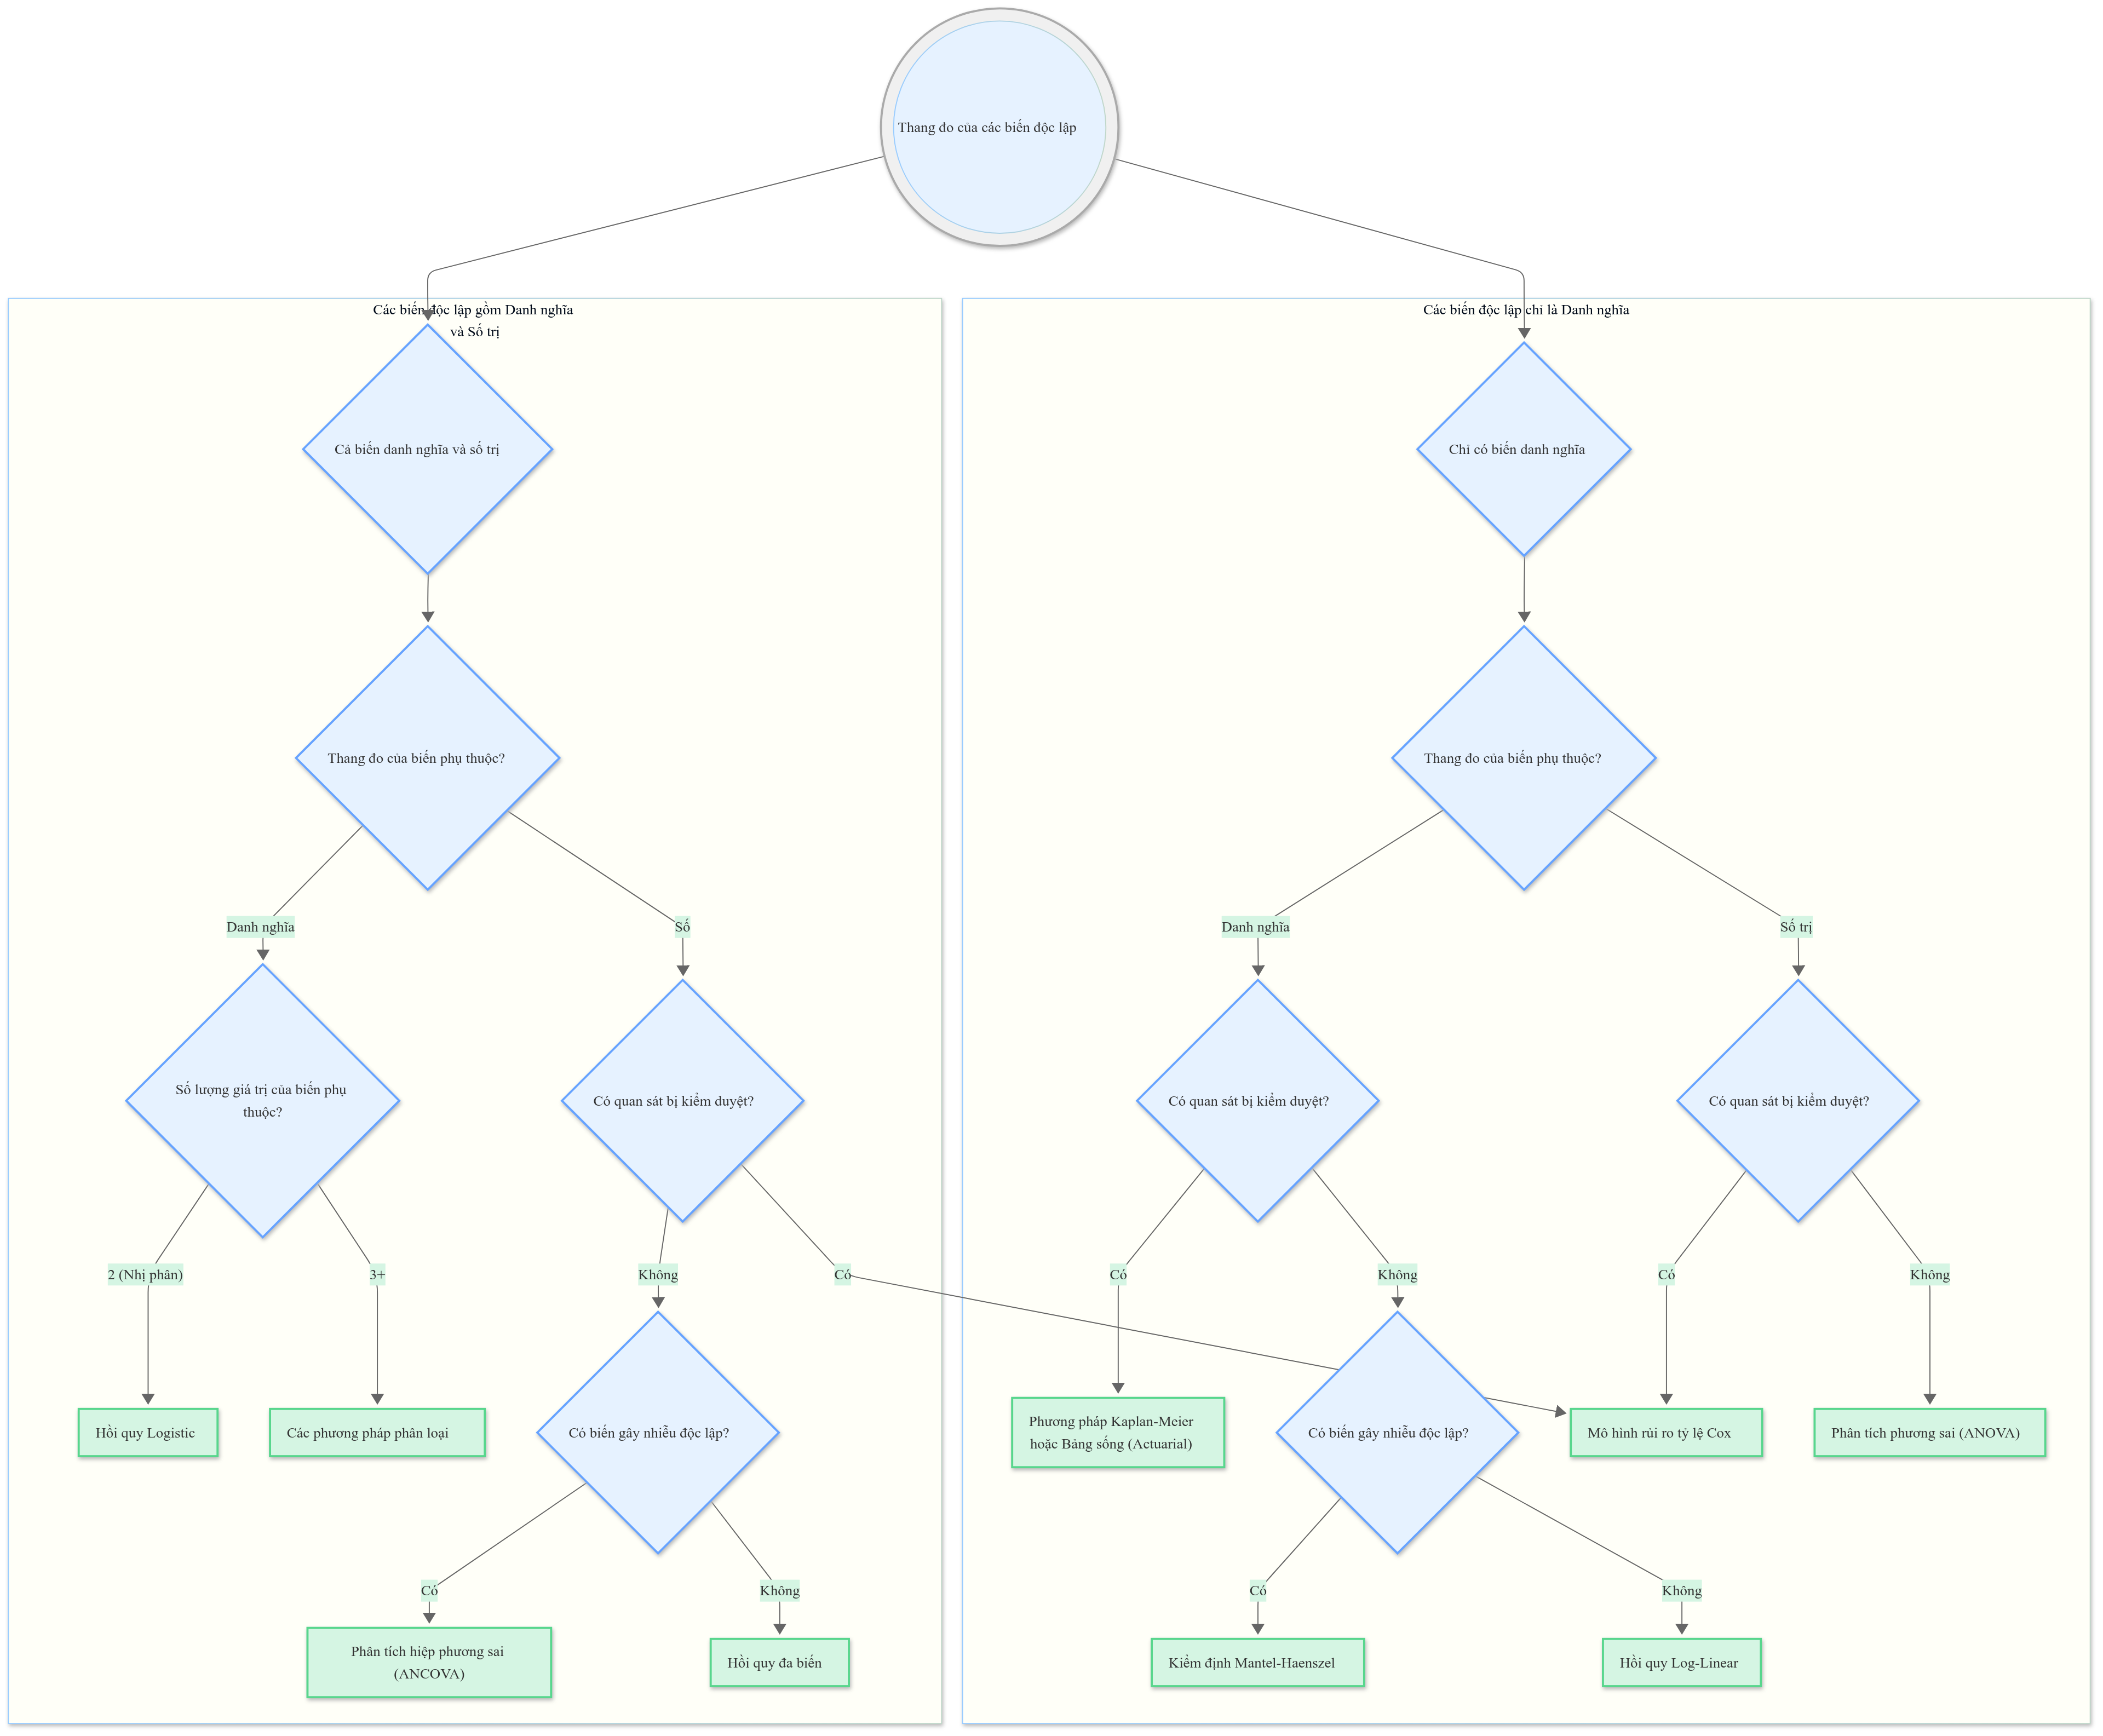
Lưu đồ C-6: Lựa chọn phương pháp cho mô hình đa biến
THUẬT NGỮ (GLOSSARY)
absolute risk increase (ARI) Gia tăng nguy cơ tuyệt đối (absolute risk increase – ARI). Sự gia tăng nguy cơ khi áp dụng một liệu pháp mới so với khi không có liệu pháp mới đó.
absolute risk reduction (ARR) Giảm nguy cơ tuyệt đối (absolute risk reduction – ARR). Sự giảm thiểu nguy cơ khi áp dụng một liệu pháp mới so với khi không có liệu pháp mới đó; đây là giá trị tuyệt đối của hiệu số giữa tỷ lệ biến cố trong nhóm thử nghiệm và tỷ lệ biến cố trong nhóm đối chứng (EER – CER).
absolute value Giá trị tuyệt đối (absolute value). Giá trị dương của một con số, bất kể con số đó là dương hay âm. Giá trị tuyệt đối của a được ký hiệu là .
actuarial analysis Phân tích theo phương pháp tính toán tuổi thọ (actuarial analysis). Xem phân tích bảng sống (life table analysis).
addition rule Quy tắc cộng (addition rule). Quy tắc phát biểu rằng xác suất để hai hay nhiều biến cố loại trừ lẫn nhau (mutually exclusive events) cùng xảy ra là tổng xác suất của từng biến cố riêng lẻ.
adjusted rate Tỷ lệ đã điều chỉnh (adjusted rate). Một tỷ lệ được điều chỉnh để nó độc lập với sự phân bố của một biến gây nhiễu có thể có. Ví dụ, các tỷ lệ được điều chỉnh theo tuổi sẽ độc lập với sự phân bố tuổi trong quần thể mà chúng được áp dụng.
age-specific mortality rate Tỷ suất tử vong theo tuổi cụ thể (age-specific mortality rate). Tỷ suất tử vong trong một nhóm tuổi cụ thể.
alpha (α) error Sai lầm alpha () (alpha error). Xem sai lầm loại I (type I error).
alpha (α) value Giá trị alpha () (alpha value). Mức alpha () được chọn trong một kiểm định giả thuyết (hypothesis test).
alternative hypothesis Giả thuyết đối (alternative hypothesis) (hay đối thuyết). Giả thuyết ngược lại với giả thuyết không (null hypothesis). Đây là kết luận được đưa ra khi giả thuyết không bị bác bỏ.
analysis of covariance (ANCOVA) Phân tích hiệp phương sai (analysis of covariance – ANCOVA). Một dạng đặc biệt của phân tích phương sai hoặc hồi quy, được sử dụng để kiểm soát ảnh hưởng của một yếu tố gây nhiễu có thể có.
analysis of residuals Phân tích phần dư (analysis of residuals). Trong hồi quy, đây là phân tích sự khác biệt giữa Y và Y’ để đánh giá các giả định và cung cấp định hướng về mức độ phù hợp của phương trình với dữ liệu.
analysis of variance (ANOVA) Phân tích phương sai (analysis of variance – ANOVA). Một quy trình thống kê xác định xem có bất kỳ sự khác biệt nào tồn tại giữa hai hoặc nhiều nhóm đối tượng trên một hoặc nhiều yếu tố hay không. Kiểm định F (F test) được sử dụng trong ANOVA.
backward elimination Loại bỏ lùi (backward elimination). Một phương pháp lựa chọn biến trong hồi quy đa biến, bắt đầu bằng cách đưa tất cả các biến vào phương trình hồi quy, sau đó loại bỏ biến đóng góp ít nhất vào khả năng dự đoán, tiếp theo là loại bỏ lần lượt các biến khác làm giảm ít nhất hệ số bội, cho đến khi tất cả các biến không có ý nghĩa thống kê đều bị loại khỏi phương trình.
bar chart or bar graph Biểu đồ cột (bar chart or bar graph). Một biểu đồ được sử dụng với các đặc tính danh nghĩa để hiển thị số lượng hoặc tỷ lệ phần trăm các quan sát có đặc tính quan tâm.
Bayes’ theorem Định lý Bayes (Bayes’ theorem). Một công thức để tính xác suất có điều kiện (conditional probability) của một biến cố, , từ xác suất có điều kiện của biến cố kia, .
bell-shaped distribution Phân phối hình chuông (bell-shaped distribution). Một thuật ngữ dùng để mô tả hình dạng của phân phối chuẩn (normal distribution) hay phân phối Gauss (Gaussian).
beta (β) error Sai lầm beta () (beta error). Xem sai lầm loại II (type II error).
bias Chệch (bias) (sai số hệ thống). Lỗi liên quan đến sự khác biệt giữa quần thể mục tiêu và quần thể được lấy mẫu; còn được gọi là sai số đo lường (measurement error), nó đe dọa tính hợp lệ (validity) của một nghiên cứu.
binary observation Quan sát nhị phân (binary observation). Một thước đo danh nghĩa chỉ có hai kết quả (ví dụ: giới tính: nam hoặc nữ; sống sót: có hoặc không).
binomial distribution Phân phối nhị thức (binomial distribution). Phân phối xác suất mô tả số lần thành công được quan sát trong phép thử độc lập, mỗi phép thử có cùng xác suất xảy ra.
biometrics Trắc lượng sinh học (biometrics). Nghiên cứu về đo lường và phân tích thống kê trong y học và sinh học.
biostatistics Thống kê y sinh (biostatistics). Ứng dụng thiết kế nghiên cứu và phân tích thống kê vào các lĩnh vực y học và sinh học.
bivariate plot Biểu đồ hai biến (bivariate plot). Một biểu đồ hai chiều hoặc biểu đồ phân tán (scatterplot) về các giá trị của hai đặc tính được đo trên cùng một tập hợp đối tượng.
blind study Nghiên cứu mù (blind study). Một nghiên cứu thực nghiệm trong đó các đối tượng không biết phương pháp điều trị mà họ đang nhận; các nhà điều tra cũng có thể không biết phương pháp điều trị mà đối tượng đang nhận; xem thêm thử nghiệm mù đôi (double-blind trial).
block design Thiết kế khối (block design). Trong phân tích phương sai, một thiết kế trong đó các đối tượng trong mỗi khối (hoặc tầng) được phân vào một phương pháp điều trị khác nhau.
Bonferroni t Kiểm định t Bonferroni (Bonferroni t). Một phương pháp so sánh các giá trị trung bình trong phân tích phương sai; còn được gọi là quy trình so sánh bội Dunn.
bootstrap Phương pháp bootstrap (bootstrap). Một phương pháp để ước tính sai số chuẩn hoặc khoảng tin cậy, trong đó một mẫu nhỏ các quan sát được chọn ngẫu nhiên từ mẫu ban đầu, các ước tính được tính toán và mẫu được trả lại cho mẫu ban đầu. Quá trình này tiếp tục nhiều lần để tạo ra một phân phối để dựa vào đó đưa ra các ước tính.
box plot Biểu đồ hộp (box plot). Một biểu đồ hiển thị cả tần suất và sự phân bố của các quan sát. Nó hữu ích để so sánh hai phân phối.
box-and-whisker plot Biểu đồ hộp và râu (box-and-whisker plot). Tương tự như biểu đồ hộp.
canonical correlation analysis Phân tích tương quan chính tắc (canonical correlation analysis). Một phương pháp thống kê nâng cao để kiểm tra mối quan hệ giữa hai bộ đo lường khoảng hoặc số trị được thực hiện trên cùng một tập hợp đối tượng.
case-control Nghiên cứu bệnh chứng (case-control). Một nghiên cứu quan sát bắt đầu với các trường hợp bệnh nhân có kết cục hoặc bệnh đang được điều tra và các đối tượng đối chứng không có kết cục hoặc bệnh đó. Sau đó, nghiên cứu nhìn lại quá khứ để xác định các yếu tố tiền đề hoặc yếu tố nguy cơ có thể có.
case-series study Nghiên cứu chuỗi ca bệnh (case-series study). Một mô tả đơn giản về các đặc điểm thú vị hoặc hấp dẫn được quan sát thấy trong một nhóm đối tượng.
categorical observation Quan sát phân loại (categorical observation). Một biến có giá trị là các hạng mục (ví dụ: loại thiếu máu). Xem thêm thang đo danh nghĩa (nominal scale).
cause-specific mortality rate Tỷ suất tử vong theo nguyên nhân cụ thể (cause-specific mortality rate). Tỷ suất tử vong do một bệnh cụ thể.
cell Ô (cell). Một hạng mục của các số đếm hoặc giá trị trong một bảng ngẫu nhiên (contingency table).
censored observation Quan sát bị kiểm duyệt (censored observation). Một quan sát có giá trị không xác định, thường là do đối tượng chưa tham gia nghiên cứu đủ lâu để kết cục quan tâm, chẳng hạn như tử vong, xảy ra.
central limit theorem Định lý giới hạn trung tâm (central limit theorem). Một định lý phát biểu rằng phân phối của các giá trị trung bình là xấp xỉ bình thường nếu cỡ mẫu đủ lớn (), bất kể phân phối cơ bản của các phép đo ban đầu.
chance agreement Sự đồng thuận ngẫu nhiên (chance agreement). Một thước đo tỷ lệ số lần hai hoặc nhiều người đánh giá đồng ý trong phép đo hoặc đánh giá của họ về một hiện tượng.
chi-square () distribution Phân phối chi-bình phương () (chi-square distribution). Phân phối được sử dụng để phân tích các số đếm trong bảng tần suất.
chi-square () test Kiểm định chi-bình phương () (chi-square test). Kiểm định thống kê được sử dụng để kiểm tra giả thuyết không rằng các tỷ lệ là bằng nhau hoặc, tương đương, các yếu tố hoặc đặc điểm là độc lập hoặc không liên quan.
classes or class limits Các lớp hoặc giới hạn lớp (classes or class limits). Các phân khu của một đặc tính số (hoặc độ rộng của các lớp) khi nó được hiển thị trong bảng tần suất hoặc biểu đồ (ví dụ: tuổi theo thập kỷ).
classification and regression tree (CART) analysis Phân tích cây phân loại và hồi quy (classification and regression tree – CART). Một phương pháp đa biến được sử dụng để phát hiện các mối quan hệ có ý nghĩa giữa các biến, sau đó được sử dụng để phát triển các mô hình dự đoán để phân loại các đối tượng trong tương lai.
clinical epidemiology Dịch tễ học lâm sàng (clinical epidemiology). Ứng dụng khoa học dịch tễ học vào y học lâm sàng và ra quyết định.
clinical trial Thử nghiệm lâm sàng (clinical trial). Một nghiên cứu thực nghiệm về một loại thuốc hoặc quy trình trong đó đối tượng là con người.
closed question Câu hỏi đóng (closed question). Một câu hỏi trong phỏng vấn hoặc bảng câu hỏi trong đó một bộ tùy chọn trả lời cụ thể được cung cấp.
cluster analysis Phân tích cụm (cluster analysis). Một phương pháp thống kê nâng cao xác định một sự phân loại hoặc phân loại từ nhiều phép đo của một tập hợp các đối tượng.
cluster random sample Mẫu ngẫu nhiên cụm (cluster random sample). Một quy trình lấy mẫu hai giai đoạn trong đó quần thể được chia thành các cụm, một mẫu ngẫu nhiên các cụm được chọn, và sau đó các mẫu ngẫu nhiên của các đối tượng trong các cụm được chọn.
coefficient of determination () Hệ số xác định () (coefficient of determination). Bình phương của hệ số tương quan. Nó được diễn giải là lượng phương sai trong một biến được giải thích bằng cách biết biến thứ hai.
coefficient of variation (CV) Hệ số biến thiên (coefficient of variation – CV). Độ lệch chuẩn chia cho giá trị trung bình (thường nhân với 100). Nó được sử dụng để có được một thước đo về sự biến thiên tương đối.
cohort Đoàn hệ (cohort). Một nhóm đối tượng cùng tham gia trong cùng một nghiên cứu theo thời gian.
cohort study Nghiên cứu đoàn hệ (cohort study). Một nghiên cứu quan sát bắt đầu với một nhóm đối tượng có yếu tố nguy cơ (hoặc đã tiếp xúc với một tác nhân) và một nhóm đối tượng thứ hai không có yếu tố nguy cơ hoặc phơi nhiễm. Cả hai nhóm đều được theo dõi tiền cứu theo thời gian để tìm hiểu có bao nhiêu người trong mỗi nhóm phát triển kết cục hoặc hậu quả quan tâm.
combination Tổ hợp (combination). Một công thức trong xác suất cho biết số cách một số lượng cụ thể các mục, ví dụ X, có thể được chọn từ tổng số mục, ví dụ n, trong toàn bộ quần thể hoặc mẫu.
complementary event Biến cố bù (complementary event). Một biến cố đối lập với biến cố đang được điều tra.
computer package Gói phần mềm máy tính (computer package). Một bộ các chương trình máy tính thống kê để phân tích dữ liệu.
concurrent controls Đối chứng đồng thời (concurrent controls). Các đối tượng đối chứng được phân vào một điều kiện giả dược hoặc đối chứng trong cùng thời gian một phương pháp điều trị hoặc quy trình thử nghiệm đang được đánh giá.
conditional probability Xác suất có điều kiện (conditional probability). Xác suất của một biến cố, chẳng hạn như A, với điều kiện một biến cố khác, chẳng hạn như B, đã xảy ra, được ký hiệu là .
confidence bands Dải tin cậy (confidence bands). Các đường ở mỗi bên của một đường hồi quy hoặc đường cong có xác suất nhất định chứa đường hoặc đường cong trong quần thể.
confidence coefficient Hệ số tin cậy (confidence coefficient). Thuật ngữ trong công thức cho một khoảng tin cậy xác định mức xác suất liên quan đến khoảng đó, chẳng hạn như 90%, 95% và 99%.
confidence interval (CI) Khoảng tin cậy (confidence interval – CI). Khoảng được tính toán từ dữ liệu mẫu có xác suất nhất định rằng tham số chưa biết, chẳng hạn như giá trị trung bình hoặc tỷ lệ, nằm trong khoảng đó. Các khoảng tin cậy phổ biến là 90%, 95% và 99%.
confidence limits Giới hạn tin cậy (confidence limits). Các giới hạn của một khoảng tin cậy. Các giới hạn này được tính toán từ dữ liệu mẫu và có xác suất nhất định rằng tham số chưa biết nằm giữa chúng.
confounded Bị gây nhiễu (confounded). Một thuật ngữ được sử dụng để mô tả một nghiên cứu hoặc quan sát có một hoặc nhiều biến gây phiền nhiễu có thể dẫn đến các diễn giải không chính xác.
confounding variable Biến gây nhiễu (confounding variable). Một biến có nhiều khả năng xuất hiện trong một nhóm đối tượng hơn là nhóm khác có liên quan đến kết cục quan tâm và do đó có khả năng gây nhầm lẫn, hoặc “làm nhiễu” kết quả.
conservative Bảo thủ (conservative). Một thuật ngữ được sử dụng để mô tả một kiểm định thống kê nếu nó làm giảm cơ hội mắc sai lầm loại I.
construct validity Tính hợp lệ của cấu trúc (construct validity). Một minh chứng cho thấy phép đo của một đặc tính có liên quan đến các phép đo tương tự của cùng một đặc tính và không liên quan đến các phép đo của các đặc tính khác.
content validity Tính hợp lệ của nội dung (content validity). Một thước đo về mức độ mà các mục trong một bài kiểm tra hoặc thang đo đại diện cho đặc tính đang được đo lường.
contingency table Bảng ngẫu nhiên (contingency table). Một bảng được sử dụng để hiển thị số đếm hoặc tần suất cho hai hoặc nhiều biến danh nghĩa hoặc định lượng.
continuity correction Hiệu chỉnh liên tục (continuity correction). Một sự điều chỉnh cho một thống kê kiểm định khi một phân phối xác suất liên tục được sử dụng để ước tính một phân phối xác suất rời rạc; ví dụ, sử dụng phân phối chi-bình phương để phân tích các bảng ngẫu nhiên.
continuous scale Thang đo liên tục (continuous scale). Một thang đo được sử dụng để đo một đặc tính số có các giá trị xảy ra trên một phổ liên tục (ví dụ là tuổi).
control event rate (CER) Tỷ lệ biến cố nhóm đối chứng (control event rate – CER). Số lượng đối tượng trong nhóm đối chứng phát triển kết cục đang được nghiên cứu.
control subjects Đối tượng đối chứng (control subjects). Trong một thử nghiệm lâm sàng, các đối tượng được phân vào điều kiện giả dược hoặc đối chứng; trong một nghiên cứu bệnh chứng, các đối tượng không mắc bệnh hoặc kết cục.
controlled for Đã kiểm soát (controlled for). Một thuật ngữ được sử dụng để mô tả một biến gây nhiễu được xem xét trong thiết kế hoặc phân tích của nghiên cứu.
controlled trial Thử nghiệm có đối chứng (controlled trial). Một thử nghiệm trong đó các đối tượng được phân vào một điều kiện đối chứng cũng như một điều kiện thử nghiệm.
corrected chi-square test Kiểm định chi-bình phương đã hiệu chỉnh (corrected chi-square test). Một kiểm định chi-bình phương cho bảng sử dụng hiệu chỉnh của Yates, làm cho nó trở nên bảo thủ hơn.
correlation coefficient (r) Hệ số tương quan (r) (correlation coefficient). Một thước đo về mối quan hệ tuyến tính giữa hai phép đo số được thực hiện trên cùng một nhóm đối tượng. Nó nằm trong khoảng từ -1 đến +1, với 0 cho thấy không có mối quan hệ. Còn được gọi là mô men tích Pearson.
cost-benefit analysis Phân tích chi phí – lợi ích (cost-benefit analysis). Một phương pháp định lượng để đánh giá sự đánh đổi giữa chi phí (hoặc bất lợi) và lợi ích (hoặc ưu điểm) của một quy trình hoặc chiến lược quản lý.
cost-effectiveness analysis Phân tích chi phí – hiệu quả (cost-effectiveness analysis). Một phương pháp định lượng để đánh giá chi phí của một quy trình hoặc chiến lược quản lý có tính đến kết cục để chọn ra lựa chọn có chi phí thấp nhất.
covariate Hiệp biến (covariate). Một biến gây nhiễu tiềm năng được kiểm soát trong phân tích hiệp phương sai.
Cox proportional hazard model or Cox model Mô hình rủi ro tỷ lệ Cox hoặc mô hình Cox (Cox proportional hazard model). Một phương pháp hồi quy được sử dụng khi kết cục bị kiểm duyệt. Các hệ số hồi quy được diễn giải là nguy cơ tương đối hoặc tỷ số chênh đã điều chỉnh.
criterion validity Tính hợp lệ của tiêu chí (criterion validity). Một chỉ báo về mức độ một bài kiểm tra hoặc thang đo dự đoán một đặc tính liên quan khác, lý tưởng là một “tiêu chuẩn vàng” nếu có.
criterion variable Biến tiêu chí (criterion variable). Kết cục (hoặc biến phụ thuộc) được dự đoán trong một bài toán hồi quy.
critical ratio Tỷ số tới hạn (critical ratio). Thuật ngữ cho điểm z được sử dụng trong các kiểm định thống kê.
critical region Miền tới hạn (critical region). Miền (hoặc tập hợp các giá trị) trong đó một thống kê kiểm định phải xảy ra để giả thuyết không bị bác bỏ.
critical value Giá trị tới hạn (critical value). Giá trị mà một thống kê kiểm định phải vượt qua (theo nghĩa giá trị tuyệt đối) để giả thuyết không bị bác bỏ.
crossover study Nghiên cứu bắt chéo (crossover study). Một thử nghiệm lâm sàng trong đó mỗi nhóm đối tượng nhận được hai hoặc nhiều phương pháp điều trị, nhưng theo các trình tự khác nhau.
cross-product ratio Tỷ số chéo sản phẩm (cross-product ratio). Xem nguy cơ tương đối (relative risk).
cross-sectional study Nghiên cứu cắt ngang (cross-sectional study). Một nghiên cứu quan sát kiểm tra một đặc tính (hoặc một tập hợp các đặc tính) trong một nhóm đối tượng tại một thời điểm; một “bản chụp nhanh” của một đặc tính hoặc tình trạng quan tâm; còn được gọi là khảo sát hoặc thăm dò ý kiến.
cross-validation Kiểm định chéo (cross-validation). Một quy trình để áp dụng kết quả của một phân tích từ một mẫu đối tượng cho một mẫu đối tượng mới để đánh giá mức độ khái quát hóa của chúng. Nó thường được sử dụng trong hồi quy.
crude rate Tỷ lệ thô (crude rate). Một tỷ lệ cho toàn bộ quần thể không cụ thể hoặc được điều chỉnh cho bất kỳ tập hợp con nào của quần thể.
cumulative frequency or percentage Tần suất hoặc tỷ lệ phần trăm tích lũy (cumulative frequency or percentage). Trong một bảng tần suất, tần suất (hoặc tỷ lệ phần trăm) của các quan sát có một giá trị nhất định cộng với tất cả các giá trị thấp hơn.
curvilinear relationship (between X and Y) Mối quan hệ đường cong (giữa X và Y) (curvilinear relationship). Một mối quan hệ cho thấy X và Y thay đổi cùng nhau, nhưng không theo các gia số không đổi.
decision analysis Phân tích quyết định (decision analysis). Một mô hình chính thức để mô tả và phân tích một quyết định; còn được gọi là ra quyết định y tế.
decision tree Cây quyết định (decision tree). Một sơ đồ về một tập hợp các hành động có thể có, với xác suất của chúng và các giá trị của các kết quả được liệt kê. Nó được sử dụng để phân tích một quy trình ra quyết định.
degrees of freedom (df) Bậc tự do (degrees of freedom – df). Một tham số trong một số phân phối xác suất thường được sử dụng; ví dụ, phân phối t và phân phối chi-bình phương.
dependent groups or samples Các nhóm hoặc mẫu phụ thuộc (dependent groups or samples). Các mẫu trong đó các giá trị trong một nhóm có thể được dự đoán từ các giá trị trong nhóm kia.
dependent variable Biến phụ thuộc (dependent variable). Biến có giá trị là kết cục trong một nghiên cứu; còn được gọi là biến phản hồi hoặc biến tiêu chí.
dependent-groups t test Kiểm định t nhóm phụ thuộc (dependent-groups t test). Xem kiểm định t cặp (paired t test).
descriptive statistics Thống kê mô tả (descriptive statistics). Các thống kê, chẳng hạn như giá trị trung bình, độ lệch chuẩn, tỷ lệ, và tỷ suất, được sử dụng để mô tả các thuộc tính của một tập hợp dữ liệu.
dichotomous observation Quan sát nhị phân (dichotomous observation). Một thước đo danh nghĩa chỉ có hai kết quả (ví dụ là giới tính: nam hoặc nữ; sống sót: có hoặc không); còn được gọi là nhị phân.
direct method of rate standardization Phương pháp chuẩn hóa tỷ lệ trực tiếp (direct method of rate standardization). Một phương pháp điều chỉnh tỷ lệ khi so sánh hai hoặc nhiều quần thể; nó đòi hỏi kiến thức về các tỷ lệ cụ thể cho mỗi loại trong các quần thể được điều chỉnh và tần suất trong ít nhất một quần thể.
directional test Kiểm định có hướng (directional test). Xem kiểm định một phía (one-tailed test).
discrete scale Thang đo rời rạc (discrete scale). Một thang đo được sử dụng để đo một đặc tính số có các giá trị nguyên (ví dụ là số lần mang thai).
discriminant analysis Phân tích phân biệt (discriminant analysis). Một kỹ thuật hồi quy để dự đoán một kết cục danh nghĩa có nhiều hơn hai giá trị; một phương pháp được sử dụng để phân loại các đối tượng vào các nhóm; còn được gọi là phân tích hàm phân biệt.
distribution Phân phối (distribution). Các giá trị của một đặc tính hoặc biến cùng với tần suất xuất hiện của chúng. Các phân phối có thể dựa trên các quan sát thực nghiệm hoặc có thể là các phân phối xác suất lý thuyết (ví dụ, bình thường, nhị thức, chi-bình phương).
distribution-free Phi phân phối (distribution-free). Các phương pháp thống kê không đưa ra giả định nào về sự phân phối của các quan sát; tức là, phi tham số.
dot plot Biểu đồ chấm (dot plot). Một phương pháp đồ họa để hiển thị phân phối tần suất của các quan sát số cho một hoặc nhiều nhóm.
double-blind trial Thử nghiệm mù đôi (double-blind trial). Một thử nghiệm lâm sàng trong đó cả đối tượng và (các) nhà điều tra đều không biết đối tượng đã nhận phương pháp điều trị nào.
dummy coding Mã hóa giả (dummy coding). Một quy trình trong đó một mã 0 hoặc 1 được gán cho một biến dự báo danh nghĩa được sử dụng trong phân tích hồi quy.
Dunnett’s procedure Quy trình Dunnett (Dunnett’s procedure). Một phương pháp so sánh bội để so sánh nhiều nhóm điều trị với một nhóm đối chứng duy nhất sau một kiểm định F có ý nghĩa trong phân tích phương sai.
effect or effect size Ảnh hưởng hoặc kích thước ảnh hưởng (effect or effect size). Độ lớn của một sự khác biệt hoặc một mối quan hệ. Nó được sử dụng để xác định cỡ mẫu và để kết hợp các kết quả giữa các nghiên cứu trong phân tích tổng hợp.
error mean square () Trung bình bình phương sai số () (error mean square). Trung bình bình phương trong mẫu số của F trong ANOVA.
error term Số hạng sai số (error term). Xem phần dư (residual).
estimation Ước lượng (estimation). Quá trình sử dụng thông tin từ một mẫu để rút ra kết luận về các giá trị của các tham số trong một quần thể.
event Biến cố (event). Một kết quả duy nhất (hoặc tập hợp các kết quả) từ một thí nghiệm.
evidence-based medicine (EBM) Y học dựa trên bằng chứng (evidence-based medicine – EBM). Việc áp dụng các bằng chứng dựa trên nghiên cứu lâm sàng và chuyên môn lâm sàng để quyết định cách quản lý bệnh nhân tối ưu.
expected frequencies Tần suất kỳ vọng (expected frequencies). Trong các bảng ngẫu nhiên, các tần suất được quan sát nếu giả thuyết không là đúng.
expected value Giá trị kỳ vọng (expected value). Được sử dụng trong việc ra quyết định để biểu thị xác suất của một kết quả nhất định trong dài hạn.
experiment (in probability) Thí nghiệm (trong xác suất) (experiment). Một quá trình thu thập dữ liệu có kế hoạch.
experimental event rate (EER) Tỷ lệ biến cố nhóm thử nghiệm (experimental event rate – EER). Số lượng đối tượng trong nhóm thử nghiệm hoặc điều trị phát triển kết cục đang được nghiên cứu.
experimental study Nghiên cứu thực nghiệm (experimental study). Một nghiên cứu so sánh liên quan đến một sự can thiệp hoặc thao tác. Nó được gọi là một thử nghiệm khi các đối tượng con người tham gia.
explanatory variable Biến giải thích (explanatory variable). Xem biến độc lập (independent variable).
exponential probability distribution Phân phối xác suất mũ (exponential probability distribution). Một phân phối xác suất được sử dụng trong các mô hình sống còn hoặc phân rã.
F distribution Phân phối F (F distribution). Phân phối xác suất được sử dụng để kiểm tra sự bằng nhau của hai ước tính của phương sai. Nó là phân phối được sử dụng với kiểm định F trong ANOVA.
F test Kiểm định F (F test). Kiểm định thống kê để so sánh hai phương sai. Nó được sử dụng trong ANOVA.
face validity Tính hợp lệ bề mặt (face validity). Một cuộc phỏng vấn hoặc khảo sát có các câu hỏi có vẻ liên quan đến mục đích.
factor Yếu tố (factor). Một đặc tính là trọng tâm của cuộc điều tra trong một nghiên cứu; được sử dụng trong phân tích phương sai.
factor analysis Phân tích yếu tố (factor analysis). Một phương pháp thống kê nâng cao để phân tích các mối quan hệ giữa một tập hợp các mục hoặc chỉ số để xác định các yếu tố hoặc các chiều nằm bên dưới chúng.
factorial design Thiết kế giai thừa (factorial design). Trong ANOVA, một thiết kế trong đó mỗi đối tượng (hoặc vật thể) nhận được một mức độ của mỗi yếu tố.
false-negative (FN) Âm tính giả (false-negative – FN). Một kết quả xét nghiệm âm tính ở một người mắc bệnh.
false-positive (FP) Dương tính giả (false-positive – FP). Một kết quả xét nghiệm dương tính ở một người không mắc bệnh.
first quartile Tứ phân vị thứ nhất (first quartile). Phân vị thứ 25.
Fisher’s exact test Kiểm định chính xác của Fisher (Fisher’s exact test). Một kiểm định chính xác cho các bảng ngẫu nhiên . Nó được sử dụng khi cỡ mẫu quá nhỏ để sử dụng kiểm định chi-bình phương.
Fisher’s z transformation Phép chuyển đổi z của Fisher (Fisher’s z transformation). Một phép biến đổi hệ số tương quan để nó có phân phối chuẩn.
focus groups Nhóm tập trung (focus groups). Một quy trình trong đó một nhóm nhỏ người được phỏng vấn về một chủ đề hoặc vấn đề; thường được sử dụng để giúp tạo ra các câu hỏi cho một cuộc khảo sát, nhưng có thể được sử dụng độc lập trong nghiên cứu định tính.
forward selection Lựa chọn tiến (forward selection). Một phương pháp xây dựng mô hình trong hồi quy đa biến, đầu tiên đưa vào phương trình hồi quy biến có tương quan cao nhất, sau đó là các biến khác lần lượt làm tăng R bội lên nhiều nhất, cho đến khi tất cả các biến có ý nghĩa thống kê đều được bao gồm trong phương trình.
frequency Tần suất (frequency). Số lần một giá trị nhất định của một quan sát xảy ra. Nó còn được gọi là số đếm (counts).
frequency distribution Phân phối tần suất (frequency distribution). Trong một tập hợp các quan sát số, danh sách các giá trị xảy ra cùng với tần suất xuất hiện của chúng. Nó có thể được thiết lập dưới dạng một bảng tần suất hoặc dưới dạng một biểu đồ.
frequency polygon Đa giác tần suất (frequency polygon). Một biểu đồ đường nối các điểm giữa của đỉnh các cột của một biểu đồ tần suất. Nó hữu ích trong việc so sánh hai phân phối tần suất.
frequency table Bảng tần suất (frequency table). Một bảng hiển thị số lượng hoặc tỷ lệ phần trăm các quan sát xảy ra ở các giá trị khác nhau (hoặc các phạm vi giá trị) của một đặc tính hoặc biến.
functional status Tình trạng chức năng (functional status). Một thước đo về khả năng của một người để thực hiện các hoạt động hàng ngày của họ, thường được gọi là các hoạt động sinh hoạt hàng ngày.
game theory Lý thuyết trò chơi (game theory). Một quá trình gán các xác suất chủ quan cho các kết quả từ một quyết định.
Gaussian distribution Phân phối Gauss (Gaussian distribution). Xem phân phối chuẩn (normal distribution).
Gehan’s test Kiểm định Gehan (Gehan’s test). Một kiểm định thống kê về sự bằng nhau của hai đường cong sống còn.
Generalized estimating equations (GEE) Phương trình ước lượng tổng quát (Generalized estimating equations – GEE). Một phương pháp đa biến phức tạp được sử dụng để phân tích các tình huống trong đó các đối tượng được lồng vào trong các nhóm khi các quan sát giữa các đối tượng không độc lập.
generalized Wilcoxon test Kiểm định Wilcoxon tổng quát (generalized Wilcoxon test). Xem kiểm định Gehan (Gehan’s test).
geometric mean (GM) Trung bình nhân (geometric mean – GM). Căn bậc n của tích của n quan sát, ký hiệu là GM hoặc G. Nó được sử dụng với logarit hoặc các phân phối lệch.
gold standard Tiêu chuẩn vàng (gold standard). Trong xét nghiệm chẩn đoán, một quy trình luôn xác định được tình trạng thực sự – có bệnh hoặc không có bệnh – của một bệnh nhân.
Hawthorne effect Hiệu ứng Hawthorne (Hawthorne effect). Một sai lệch được đưa vào một nghiên cứu quan sát khi các đối tượng biết họ đang tham gia một nghiên cứu, và chính kiến thức này ảnh hưởng đến hành vi của họ.
hazard function Hàm nguy cơ (hazard function). Xác suất một người chết trong một khoảng thời gian nhất định, với điều kiện người đó đã sống cho đến đầu khoảng thời gian đó. Nghịch đảo của nó là thời gian sống trung bình.
hazard ratio Tỷ số nguy cơ (hazard ratio). Tương tự như tỷ số rủi ro, nó là tỷ số rủi ro của kết cục (chẳng hạn như tử vong) xảy ra tại bất kỳ thời điểm nào trong một nhóm so với một nhóm khác.
hierarchical design Thiết kế phân cấp (hierarchical design). Một thiết kế nghiên cứu trong đó một hoặc nhiều phương pháp điều trị được lồng vào trong các cấp độ của một yếu tố khác, chẳng hạn như bệnh nhân trong các bệnh viện.
hierarchical regression Hồi quy phân cấp (hierarchical regression). Một phương pháp xây dựng mô hình logic trong hồi quy đa biến, trong đó các nhà điều tra nhóm các biến theo chức năng của chúng và thêm chúng vào phương trình hồi quy như một nhóm hoặc một khối.
histogram Biểu đồ tần suất (histogram). Một biểu đồ của một phân phối tần suất của các quan sát số.
historical cohort study Nghiên cứu đoàn hệ lịch sử (historical cohort study). Một nghiên cứu đoàn hệ sử dụng các hồ sơ hiện có hoặc dữ liệu lịch sử để xác định ảnh hưởng của một yếu tố nguy cơ hoặc phơi nhiễm đối với một nhóm bệnh nhân.
historical controls Đối chứng lịch sử (historical controls). Trong các thử nghiệm lâm sàng, các quan sát đã được thu thập trước đây trên các bệnh nhân được sử dụng làm các giá trị đối chứng để so sánh với phương pháp điều trị.
homogeneity Tính đồng nhất (homogeneity). Tình huống trong đó độ lệch chuẩn của biến phụ thuộc (Y) là như nhau, bất kể giá trị của biến độc lập (X); một giả định trong ANOVA và hồi quy.
homoscedasticity Phương sai đồng nhất (homoscedasticity). Xem tính đồng nhất (homogeneity).
Hosmer and Lemeshow’s Goodness of Fit Test Kiểm định độ phù hợp Hosmer và Lemeshow (Hosmer and Lemeshow’s Goodness of Fit Test). Một kiểm định đa biến được sử dụng để kiểm tra ý nghĩa của các kết quả tổng thể từ một phân tích hồi quy logistic.
hypothesis test Kiểm định giả thuyết (hypothesis test). Một cách tiếp cận suy luận thống kê dẫn đến quyết định bác bỏ hoặc không bác bỏ giả thuyết không.
Bảng chú giải thuật ngữ Y học Anh Việt
| STT | Thuật ngữ tiếng Anh | Phiên âm IPA | Nghĩa Tiếng Việt |
|---|---|---|---|
| 1 | Flowchart | /ˈfloʊ.tʃɑːrt/ | Lưu đồ |
| 2 | Mean | /miːn/ | Giá trị trung bình |
| 3 | Median | /ˈmiː.di.ən/ | Trung vị |
| 4 | Ordinal measure | /ˈɔːr.dɪ.nəl ˈmeʒ.ər/ | Thước đo thứ tự |
| 5 | Numerical measure | /njuːˈmer.ɪ.kəl ˈmeʒ.ər/ | Thước đo số trị |
| 6 | Proportion | /prəˈpɔːr.ʃən/ | Tỷ lệ |
| 7 | Nominal measure | /ˈnɑː.mɪ.nəl ˈmeʒ.ər/ | Thước đo danh nghĩa |
| 8 | Association | /əˌsoʊ.siˈeɪ.ʃən/ | Mối liên hệ |
| 9 | Independent variable | /ˌɪn.dɪˈpen.dənt ˈver.i.ə.bəl/ | Biến độc lập |
| 10 | Dependent variable | /dɪˈpen.dənt ˈver.i.ə.bəl/ | Biến phụ thuộc |
| 11 | Normally Distributed | /ˈnɔːr.mə.li dɪˈstrɪb.juː.tɪd/ | Phân phối chuẩn |
| 12 | t-test | /ˈtiː.test/ | Kiểm định t |
| 13 | Sign test | /saɪn test/ | Kiểm định dấu |
| 14 | Independent Groups | /ˌɪn.dɪˈpen.dənt ɡruːps/ | Các nhóm độc lập |
| 15 | Variance | /ˈver.i.əns/ | Phương sai |
| 16 | Wilcoxon rank-sum test | /wɪlˈkɒksən ræŋk sʌm test/ | Kiểm định tổng hạng Wilcoxon |
| 17 | Paired t-test | /peərd ˈtiː.test/ | Kiểm định t cặp |
| 18 | Wilcoxon signed-ranks test | /wɪlˈkɒksən saɪnd ræŋks test/ | Kiểm định hạng dấu Wilcoxon |
| 19 | One-Way ANOVA | /wʌn weɪ əˈnoʊ.və/ | Phân tích phương sai một yếu tố |
| 20 | Two-Way ANOVA | /tuː weɪ əˈnoʊ.və/ | Phân tích phương sai hai yếu tố |
| 21 | Kruskal-Wallis test | /ˌkrʌs.kəl ˈwɑː.lɪs test/ | Kiểm định Kruskal-Wallis |
| 22 | Repeated Measures ANOVA | /rɪˈpiː.tɪd ˈmeʒ.ərz əˈnoʊ.və/ | Phân tích phương sai đo lường lặp lại |
| 23 | Friedman test | /ˈfriːd.mən test/ | Kiểm định Friedman |
| 24 | z Approximation | /ziː əˌprɑːk.sɪˈmeɪ.ʃən/ | Xấp xỉ z |
| 25 | Expected Frequency | /ɪkˈspek.tɪd ˈfriː.kwən.si/ | Tần suất kỳ vọng |
| 26 | Fisher’s Exact Test | /ˈfɪʃ.ərz ɪɡˈzækt test/ | Kiểm định chính xác của Fisher |
| 27 | Chi-square test | /ˌkaɪˈskwer test/ | Kiểm định Chi-bình phương () |
| 28 | McNemar test | /məkˈnɛ.mɑːr test/ | Kiểm định McNemar |
| 29 | Cochran’s Q test | /ˈkɒk.rənz kjuː test/ | Kiểm định Q của Cochran |
| 30 | Relative Risk | /ˈrel.ə.tɪv rɪsk/ | Nguy cơ tương đối |
| 31 | Spearman’s rho | /ˈspɪər.mənz roʊ/ | Tương quan hạng Spearman |
| 32 | Regression | /rɪˈɡreʃ.ən/ | Hồi quy |
| 33 | Pearson Correlation | /ˈpɪər.sən ˌkɔːr.əˈleɪ.ʃən/ | Tương quan Pearson |
| 34 | Correlation Coefficient | /ˌkɔːr.əˈleɪ.ʃən ˌkoʊ.ɪˈfɪʃ.ənt/ | Hệ số tương quan |
| 35 | Fisher’s z Transformation | /ˈfɪʃ.ərz ziː ˌtræns.fəˈmeɪ.ʃən/ | Phép chuyển đổi z của Fisher |
| 36 | Regression Coefficient | /rɪˈɡreʃ.ən ˌkoʊ.ɪˈfɪʃ.ənt/ | Hệ số hồi quy |
| 37 | Censored Observations | /ˈsen.sərd ˌɑːb.zəˈveɪ.ʃənz/ | Quan sát bị kiểm duyệt |
| 38 | Confounding Variable | /kənˈfaʊn.dɪŋ ˈver.i.ə.bəl/ | Biến gây nhiễu |
| 39 | Kaplan-Meier method | /ˌkæp.lən ˈmaɪ.ər ˈmeθ.əd/ | Phương pháp Kaplan-Meier |
| 40 | Actuarial method | /ˌæk.tʃuˈer.i.əl ˈmeθ.əd/ | Phương pháp tính toán tuổi thọ (Bảng sống) |
| 41 | Mantel-Haenszel test | /ˈmæn.təl ˈhen.zəl test/ | Kiểm định Mantel-Haenszel |
| 42 | Log-Linear Regression | /lɔːɡ ˈlɪn.i.ər rɪˈɡreʃ.ən/ | Hồi quy Log-Linear |
| 43 | Cox Proportional Hazard Model | /kɒks prəˈpɔːr.ʃən.əl ˈhæz.ərd ˈmɒd.əl/ | Mô hình rủi ro tỷ lệ Cox |
| 44 | Logistic Regression | /loʊˈdʒɪs.tɪk rɪˈɡreʃ.ən/ | Hồi quy Logistic |
| 45 | Classification Methods | /ˌklæs.ɪ.fɪˈkeɪ.ʃən ˈmeθ.ədz/ | Các phương pháp phân loại |
| 46 | ANCOVA (Analysis of Covariance) | /ænˈkoʊ.və/ | Phân tích hiệp phương sai |
| 47 | Multiple Regression | /ˈmʌl.tɪ.pəl rɪˈɡreʃ.ən/ | Hồi quy đa biến |
| 48 | Absolute risk increase (ARI) | /ˌæb.sə.luːt rɪsk ˈɪŋ.kriːs/ | Gia tăng nguy cơ tuyệt đối |
| 49 | Absolute risk reduction (ARR) | /ˌæb.sə.luːt rɪsk rɪˈdʌk.ʃən/ | Giảm nguy cơ tuyệt đối |
| 50 | Absolute value | /ˌæb.sə.luːt ˈvæl.juː/ | Giá trị tuyệt đối |
TÀI LIỆU THAM KHẢO
- Abraham A, Alabdali M, Alsulaiman A et al. The sensitivity and specificity of the neurological examination in polyneuropathy patients with clinical and electrophysiological correlations. PLoS One. 2017;12(3):e0171597.
- Alderman EL, Bourassa MG, Cohen LS et al. Ten-year follow-up of survival and myocardial infarction in the randomized Coronary Artery Surgery Study. Circulation. 1990;82:1629-1646.
- Alonso-Coello P, Irfan A, Solà I et al. The quality of clinical practice guidelines over the last two decades: a systematic review of guideline appraisal studies. Qual Saf Health Care. 2010;19:e58.
- Altman DG, De Stavola BL, Love SB, Stepniewska KA. Review of survival analysis published in cancer journals. Br J Cancer, 1995;72:511-518.
- Anasetti C, Doney KC, Storb R et al. Marrow transplantation for severe aplastic anemia. Ann Intern Med. 1986;104:461-466.
- Anastasi A, Urbina S. Psychological Testing. 7th ed. London, UK: Macmillan; 1997.
- Anderson KB, Simasathien S, Watanaveeradej V et al. Clinical and laboratory predictors of influenza infection among individuals with influenza-like illness presenting to an urban Thai hospital over a five-year period. PLoS One. 2018;13(3):e0193050.
- Andrewes D, Kaye A, Aitken S, Parr C, Bates L, Murphy M. The ESDQ: a new method of assessing emotional and social dysfunction in patients following brain surgery. J Clin Exp Neuropsychol. 2003:25:173-189.
- Bagwell K, Wu X, Baum ED et al. Cost-effectiveness analysis of intracapsular tonsillectomy and total tonsillectomy for pediatric obstructive sleep apnea. Appl Health Econ Health Policy. 2018;16:527.
- Bajwa K, Szabo E, Kjellstrand CM. A prospective study of risk factors and decision making in discontinuation of dialysis. Arch Intern Med. 1996;156:2571-2577.
- Bale P, Bradbury D, Colley E. Anthropometric and training variables related to 10 km running performance. Br J Sports Med. 1986;20:170-173.
- Barker DJP. Rise and fall of western diseases. Nature. 1989;338:371-372.
- Bartko JJ. Rationale for reporting standard deviations rather than standard errors of the mean. Am J Psychiatry. 1985;142:1060.
- Bellou V, Belbasis L, Tzoulaki I, Evangelou E. Risk factors for type 2 diabetes mellitus: an exposure-wide umbrella review of meta-analyses. PLoS One. 2018;13(3):e0194127.
- Berkson J. Limitations of the application of four-fold table analyses to hospital data. Biometrics Bull. 1946;2:47-53.
- Berry G, Matthews JNS, Armitage P. Statistical Methods in Medical Research. 4th ed. Oxford, UK: Blackwell Scientific; 2001.
- Billioti de Gage S, Yola M, Thierry D et al. Benzodiazepine use and risk of Alzheimer’s disease: case-control study. BMJ. 2014;349:g5205.
- Bordage G, Dawson B. Experimental study design and grant writing in eight steps and 28 questions. Med Educ. 2003;37:376-385.
- Bos-Touwen I, Schuurmans M, Monninkhof EM et al. Patient and disease characteristics associated with activation for self-management in patients with diabetes, chronic obstructive pulmonary disease, chronic heart failure and chronic renal disease: a cross-sectional survey study. PLoS One. 2015;10(5):e0126400.
- Bottegoni C, Dei Giudici L, Salvemini S et al. Homologous platelet-rich plasma for the treatment of knee osteoarthritis in selected elderly patients: an open-label, uncontrolled, pilot study. Ther Adv Musculoskelet Dis. 2016.
- Box GEP, Non-normality and tests on variance. Biometrika. 1953;40:318-335.
- Box GEP. Some theorems on quadratic forms applied in the study of the analysis of variance. Ann Math Stat. 1954;25:290-302.
- Brtnikova M, Crane LA, Allison MA, Hurley LP, Beaty BL, Kempe A. A method for achieving high response rates in national surveys of U.S. primary care physicians. PLoS One. 2018;13(8):e0202755.
- Buchsbaum DG, Buchanan RG, Centor RM, Schnoll SH, Lawton MJ. Screening for alcohol abuse using CAGE scores and likelihood ratios. Ann Intern Med. 1991;115:774-777.
- Burns N, Grove SK. Understanding Nursing Research. 6th ed. Philadelphia, PA: WB Saunders; 2014.
- Bush B, Shaw S, Cleary P, Delbanco TL, Aronson MD. Screening for alcohol abuse using the CAGE questionnaire. Am J Med. 1987;82:231-235.
- Byrt T. How good is that agreement? (Letter to editor). Epidemiology. 1996;7:561.
- Cai J, Karam JA, Parvizi J, Smith EB, Sharkey PF. Aquacel surgical dressing reduces the rate of acute pji following total joint arthroplasty: a case-control study. The Rothman Institute at Thomas Jefferson University Hospital, Philadelphia, PA. J Arthroplasty. 2014;29:1098-1100.
- Caiola E, Litaker D. Factors influencing the selection of general internal medicine fellowship programs. J Gen Intern Med. 2000;15:656-658.
- CASS Principal Investigators and Associates: Coronary Artery Surgery Study (CASS). A randomized trial of coronary bypass surgery. Circulation. 1983;68:951-960.
- Centers for Disease Control and Prevention. Seasonal Influenza Vaccine Safety: A Summary for Clinicians. 2017.
- Chatfield C. Problem Solving: A Statistician’s Guide. 2nd ed. London, UK: Chapman & Hall; 1995.
- Chaudhry M, Chan C, Su-Myat S et al. Ascertaining cancer survivors in Ontario using the Ontario Cancer Registry and administrative data. J Clin Oncol. 2018;36:7(suppl):34-34
- Chochinov HM, Hassard T, McClement S et al. The Patient Dignity Inventory: a novel way of measuring dignity-related distress in palliative care. J Pain Symptom Manage. 2008;36(6):559-571.
- Ciemins EL, Coon PJ, Coombs NC et al. Intent-to-treat analysis of a simultaneous multisite telehealth diabetes prevention program. BMJ Open Diabetes Res Care. 2018;6:e000515.
- Cohen J. Statistical Power Analysis for the Behavioral Sciences. 2nd ed. Cambridge, MA: Academic Press; 1988.
- Cohen J. A power primer. Psychol Bull. 1992;112(1):155-159.
- Colditz GA, Manson JE, Hankinson SE. The Nurses’ Health Study: 20-year contribution to the understanding of health among women. J Womens Health. 1997;6:49-62.
- Collett D. Modelling Survival Data in Medical Research. 2nd ed. London, UK: Chapman & Hill; 2003.
- Colton T. Statistics in Medicine. London, UK: Little, Brown Book Group; 1974.
- Conover WJ. Practical Nonparametric Statistics. 3rd ed. Hoboken, NJ: Wiley; 1999.
- Conover WJ, Iman RL. Rank transformations as a bridge between parametric and nonparametric statistics. Am Stat. 1981;35:124-129.
- Cornelis E, Gorus E, Beyer I, Bautmans I, De Vriendt P. Early diagnosis of mild cognitive impairment and mild dementia through basic and instrumental activities of daily living: Development of a new evaluation tool. PLoS Med. 2017;14(3):e1002250.
- Cox DR. Regression models and life tables. JR Stat Soc Series B. 1972;34:187-220.
- Cramer JA, Spilker B. Quality of Life and Pharmacoeconomics: An Introduction. 2nd ed. Philadelphia, PA: Lippincott-Raven; 1998.
- Cutler S, Ederer F. Maximum utilization of the lifetable method in analyzing survival. J Chronic Dis. 1958:8:699-712.
- D’Angio CT, Maniscalco WM, Pichichero ME. Immunologic responses of extremely premature infants to tetanus, Haemophilus influenzae, and polio immunizations. Pediatrics. 1995;96:18-22.
- Dabi Y, Nedellec S, Bonneau C, Trouchard B, Rouzier R, Benachi A. Clinical validation of a model predicting the risk of preterm delivery. PLoS One. 2017;12(2):e0171801.
- Daniel WW, Cross CL. Biostatistics: A Foundation for Analysis in the Health Sciences. 11th ed. Hoboken, NJ: Wiley; 2018.
- Davidoff F. In the teeth of the evidence: The curious case of evidence-based medicine. Mt Sinai J Med. 1999;66:75-83.
- Davids BO, Hutchins SS, Jones CP et al. Disparities in life expectancy across US counties linked to county social factors, 2009 Community Health Status Indicators (CHSI). J Racial Ethn Health Disparities. 2014;1:2.
- Dawson B. Review of Multivariable Statistics. Teach Learn Med. 2000;12:108.
- Dawson-Saunders B, Azen S, Greenberg R, Reed A. The instruction of biostatistics in medical schools. Am Stat, 1987;41(4):263-266.
- de Boer RA, Nayor M, deFilippi CR et al. Association of cardiovascular biomarkers with incident heart failure with preserved and reduced ejection fraction. JAMA Cardiol. 2018.
- Dennison BA, Rockwell HL, Baker SL. Excess fruit juice consumption by preschool-aged children is associated with short stature and obesity. Pediatrics. 1997;99:15-22.
- Detsky AS, Abrams HB, McLaughlin JR et al. Predicting cardiac complication in patients undergoing non-cardiac surgery. J Gen Intern Med. 1986;1:211-219.
- Deyo RA, Diehl AK. Cancer as a cause of low back pain: Frequency, clinical presentation, and diagnostic strategies? J Gen Intern Med. 1988;3:230-238.
- Deyo RA, Rainville J, Kent DL. What can the history and physical examination tell us about low back pain? JAMA. 1992;268:760-765.
- Deyo RA, Jarvik JG, Chou R. Low back pain in primary care. BMJ. 2014;349:g4266.
- Dillman DA, Smyth JD, Christian LM. Mail & Internet Surveys. 4th ed. Hoboken, NJ: Wiley; 2014.
- Dittrich N, Agostino D, Antonini Philippe R, Guglielmo LGA, Place N. Effect of hypnotic suggestion on knee extensor neuromuscular properties in resting and fatigued states. PLoS One. 2018;13(4):e0195437.
- Dixon MR, Haukoos JS, Udani SM et al. Carcinoembryonic antigen and albumin predict survival in patients with advanced colon and rectal cancer. Arch Surg. 2003;138:962-966.
- Dunn OJ, Clark VA. Applied Statistics: Analysis of Variance and Regression. 2nd ed. Hoboken, NJ: Wiley; 1987.
- Durand MJ, Murphy SA, Schaefer KK et al. Impaired hyperemic response to exercise post stroke. PLoS One. 2015;10(12):e0144023.
- Dyrbye LN, Burke SE, Hardeman RR et al. Association of clinical specialty with symptoms of burnout and career choice regret among us resident physicians. JAMA. 2018;320(11):1114-1130.
- Dysangco A, Liu Z, Stein JH, Dubé MP, Gupta SK. HIV infection, antiretroviral therapy, and measures of endothelial function, inflammation, metabolism, and oxidative stress. PLoS One. 2017;12(8):e0183511.
- Eckel N, Li Y, Kuxhaus O, Stefan N, Hu FB, Schulze MB. Transition from metabolic healthy to unhealthy phenotypes and association with cardiovascular disease risk across BMI categories in 90 257 women (the Nurses’ Health Study): 30 year follow-up from a prospective cohort study. Lancet Diabetes Endocrinol. 2018;6(9):714-724.
- Eddy DM. Clinical Decision Making: From Theory to Practice: A Collection of Essays. Sudbury, MA: Jones & Bartlett; 1996.
- Einarsson K, Nilsell K, Leijd B, Angelin B. Influence of age on secretion of cholesterol and synthesis of bile acids by the liver. N Engl J Med. 1985;313:277-282.
- Elveback LR, Guillier CL, Keating FR. Health normality, and the ghost of Gauss. JAMA. 1970;211:69-75.
- Enright PL, McBurnie MA, Bittner V et al.; Cardiovascular Health Study: The 6-min walk test: A quick measure of functional status in elderly adults. Chest. 2003;123:387-398.
- Fagan TJ. Nomogram for Bayes’ theorem. N Engl J Med. 1975;293:257.
- Feinstein AR. Clinical Epidemiology: The Architecture of Research. Philadelphia, PA: WB Saunders; 1985.
- Feinstein AR, Sosin DM, Wells CK. The Will Rogers phenomenon. N Engl J Med. 1985;312:1604-1608.
- Few S. Effective_Chart_Design.pdf. 2018.
- Few S. Visual Perception of Variation in Data Displays. Visual Business Intelligence Newsletter. 2016.
- Few S. Now You See It: Simple Visualization Techniques for Quantitative Analysis. San Francisco, CA: Analytics Press; 2009.
- Fink A, Kosecoff J. How to Conduct Surveys: A Step-by-Step Guide. Thousand Oaks, CA: SAGE; 1998.
- Finnerup N, Attal N, Haroutounian S et al. Pharmacotherapy for neuropathic pain in adults: a systematic review and meta-analysis. Lancet Neurol. 2015;14(2):162-173.
- Fisher LD, van Belle G. Biostatistics: A Methodology for Health Sciences. Hoboken, NJ: Wiley; 1996.
- Fleiss JL. Statistical Methods for Rates and Proportions. 2nd ed. Hoboken, NJ: Wiley; 1981.
- Fleiss JL. Design and Analysis of Clinical Experiments. Hoboken, NJ: Wiley; 1999.
- Fox J., Bouchet-Valat M. (2019). Rcmdr: R Commander. R package version 2.5-3.
- Fox J, Carvalho M. The RcmdrPlugin.survival package: Extending the R Commander interface to survival analysis. J Stat Softw. 2012;49(7).
- Gage TP. Managing the cancer risk in chronic ulcerative colitis. J Clin Gastroenterol. 1986;8:50-57.
- Garb JL. Understanding Medical Research. London, UK: Little, Brown Book Group; 1996.
- Gardner CD, Trepanowski JF, Del Gobbo LC et al. Effect of low-fat vs low-carbohydrate diet on 12-month weight loss in overweight adults and the association with genotype pattern or insulin secretion. The DIETFITS randomized clinical trial. JAMA. 2018;319(7):667-679.
- Gardner MJ, Altman DG. Confidence intervals rather than P values: estimation rather than hypothesis testing. BMJ. 1986;292:746-750.
- Gardner MJ, Altman DG. Statistics with Confidence. London, UK: BMJ Books; 1989.
- Gehan EA. A generalized Wilcoxon test for comparing arbitrarily singly-censored samples. Biometrika, 1965;52:15-21.
- Gelber DA, Pfeifer M, Dawson B, Shumer M. Cardiovascular autonomic nervous system tests: determination of normative values and effect of confounding variables. J Auton Nerv Syst. 1997;62:40-44.
- Gillings D, Koch G. The application of the principle of intention-to-treat to the analysis of clinical trials. Drug Information J. 1991;25:411-424.
- Glass GV. Integrating findings: the meta-analysis of research. In Shulman LS Review of Research in Education. Australia: Peacock; 1977:351-379.
- Glass GV, Stanley JC. Statistical Methods in Education and Psychology. Upper Saddle River, NJ: Prentice Hall; 1970.
- Glazer ES, Neill KG, Frakes JM et al. Systematic review and case series report of acinar cell carcinoma of the pancreas. Cancer Control. 2016;446-454.
- Gold MR, Gold SR, Weinstein MC Cost-Effectiveness in Health and Medicine. Oxford, UK: Oxford University Press; 1996.
- Goldman L. Cardiac risk in noncardiac surgery: an update. Anesth Analg. 1995;80:810-820.
- Goldman L, Caldera DL, Nussbaum SR et al. Multifactorial index of cardiac risk in non-cardiac surgical procedures. N Engl J Med. 1977;297:845-850.
- Goldsmith JM, Kalish SB, Green D, Chmiel JS, Wallemark CB, Phair JP. Sequential clinical and immunologic abnormalities in hemophiliacs. Arch Intern Med. 1985;145:431-434.
- Gonzalo MA, Grant C, Moreno I et al. Glucose tolerance, insulin secretion, insulin sensitivity and glucose effectiveness in normal and overweight hyperthyroid women. Clin Endocrinol (Oxf). 1996;45:689-697.
- Good DC, Henkle JQ, Gelber D, Welsh J, Verhulst S. Sleep-disordered breathing and poor functional outcome after stroke. Stroke. 1996;27:252-259.
- Gordon T, Kannel WB. The Framingham, Massachusetts, Study twenty years later. In: Kessler IJ, Levin ML The Community as an Epidemiologic Laboratory. Baltimore, MA: Johns Hopkins Press; 1970.
- Gordon T, Moore FE, Shurtleff D, Dawber TR. Some methodologic problems in the long term study of cardiovascular disease: observations on the Framingham Study. J Chronic Dis. 1959;10:186-206.
- Goto T, Tsugawa Y, Faridi MK, Camargo CA, Hasegawa K. Reduced risk of acute exacerbation of copd after bariatric surgery: a self-controlled case series study. Chest. 2018;153(3):611-617.
- Gotto AM. The Multiple Risk Factor Intervention Trial (MRFIT): a return to a landmark trial. JAMA. 1997;277:595-597.
- Greenberg RS. Prospective studies. In Kotz S, Johnson NL Encyclopedia of Statistical Sciences. Vol 7. Hoboken, NJ: Wiley; 1986: 315-319.
- Greenberg RS. Retrospective studies. In Kotz S, Johnson NL Encyclopedia of Statistical Sciences. Vol 8. Hoboken, NJ: Wiley; 1988: 120-124
- Greenberg RS, Daniels SR, Flanders WD, Eley JW, Boring JR. Medical Epidemiology: Population Health and Effective Health Care. 5th ed. New York, NY: McGraw-Hill; 2015.
- Greenhalgh T. How to read a paper: Papers that report diagnostic or screening tests. BMJ. 1997a;315:540-543.
- Greenhalgh T. How to Read a Paper: The Basics of Evidence Based Medicine. London, UK: BMJ Publishing Group; 1997b.
- Greenland S. Null misinterpretation in statistical testing and its impact on health risk assessment. Prev Med. 2011;53:225-228.
- Greenland S, Senn SJ, Rothman KJ et al. Statistical tests, P values, confidence intervals, and power; a guide to misinterpretations. Eur J Epidemiol. 2016;31:337.
- Grucza RA, Przybeck TR, Spitznagel EL, Cloninger CR. Personality and depressive symptoms: a multi-dimensional analysis. J Affect Disord. 2003;74:123-130.
- Guo Y, Bian J, Li Q et al. A 3-minute test of cardiorespiratory fitness for use in primary care clinics. PLOS ONE. 2018;13(7):e0201598.
- Gurusamy KS, Riviere D, van Laarhoven CJH et al. Cost-effectiveness of laparoscopic versus open distal pancreatectomy for pancreatic cancer. PLoS One. 2017;12(12):e0189631.
- Gurwitz JH, Field TS, Harrold LR et al. Incidence and preventability of adverse drug events among older persons in the ambulatory setting. JAMA. 2003;289:1107-1116.
- Guyatt GH, DiCenso A, Farewell V, Willan A, Griffith L. Randomized trials versus observational studies in adolescent pregnancy prevention. J Clin Epidemiol. 2000;53:167-174.
- Hartz AJ, Anderson AJ, Brooks HL, Manley JC, Parent GT, Barboriak JJ. The association of smoking with cardiomyopathy. N Engl J Med. 1984;311:1201-1206.
- Hays WL. Statistics for the Social Sciences. 5th ed. New York, NY: Holt, Rinehart and Winston; 1997.
- He Y, Meng Z, Jia Q et al. Sleep Quality of Patients with Differentiated Thyroid Cancer. PLoS One. 2015;10(6):e0130634.
- Hébert R, Brayne C, Spiegelhalter D. Incidence of functional decline and improvement in a community-dwelling very elderly population. Am J Epidemiol. 1997;145:935-944.
- Helmrich SP, Rosenberg L, Kaufman DW, Strom B, Shapiro S. Venous thromboembolism in relation to oral contraceptive use. Obstet Gynecol. 1987:69:91-95.
- Henderson AS, Korten AE, Jacomb PA et al. The course of depression in the elderly: a longitudinal community-based study in Australia. Psychol Med. 1997;27:119-129.
- Hindmarsh PC, Brook CGD. Final height of short normal children treated with growth hormone. Lancet. 1996;348:13-16.
- Hodgson LG, Cutler SJ. Anticipatory dementia and well-being. Am J Alzheimer’s Dis. 1997;12:62-66.
- Hoffman RM, Lo M, Clark JA et al. Treatment decision regret among long-term survivors of localized prostate cancer: results from the prostate cancer outcomes study. J Clin Oncol. 2017 35(20):2306-2314.
- Hollander M, Wolfe DA. Nonparametric Statistical Methods. 2nd ed. Hoboken, NJ: Wiley; 1998.
- Hosmer DW, Lemeshow S. Applied Survival Analysis. Hoboken, NJ: Wiley; 1999.
- Hosmer DW, Lemeshow S. Applied Logistic Regression. 2nd ed. Hoboken, NJ: Wiley; 2000.
- Hotelling H. The selection of variates for use in prediction with some comments on the problem of nuisance parameters. Ann Math Stat. 1940;11:271-283.
- Howcroft J, Lemaire ED, Kofman J, McIlroy WE. Elderly fall risk prediction using static posturography. PLoS One. 2017;12(2):e0172398.
- Huang ES, Stafford RS. National patterns in the treatment of urinary tract infections in women by ambulatory care physicians. Arch Intern Med. 2002;162:41-47.
- Hulley SB, Cummings SR, Browner WS et al. Designing Clinical Research. 4th ed. Philadelphia, PA: Lippincott Williams & Wilkins; 2013.
- Ilango K, Vijayakumar T, Dubey G, Agrawal A. An Enlarged Vision on Various Types of Study Design in Human Subjects. Global j pharmacol. 2012;6(3):216-221.
- Ingelfinger JA, Ware JH, Thibodeau LA. Biostatistics in Clinical Medicine. 3rd ed. Chicago, IL: McGraw-Hill; 1994.
- International Committee of Medical Journal Editors. Uniform requirements for manuscripts submitted to biomedical journals. Annals Intern Med. 1997;126:36-47.
- International Committee of Medical Journal Editors. Recommendations for the Conduct, Reporting, Editing, and Publication of Scholarly Work in Medical Journals. 2018.
- International Conference on Harmonization (ICH) E9 Expert Working Group. Statistical principles for clinical trials: ICH harmonized tripartite guideline. Stat Med. 1999;18:1905-1942.
- loannidis JPA, Cappelleri JC, Lau J. Issues in comparisons between meta-analyses and large trials. JAMA. 1998;279:1089-1093.
- Ioannidis JPA. Hijacked evidence-based medicine: stay the course and throw the pirates overboard. J Clin Epidemiol. 2017;84:11-13.
- Iribarren C, Reed DM, Burchfiel CM, Dwyer JH. Serum total cholesterol and mortality: confounding factors and risk modification in Japanese-American Men. JAMA, 1995;273(24):1926-1932.
- Jackson AS, Stanforth PR, Gagnon J et al. The effect of sex, age, and race on estimating percentage body fat from body mass index: the Heritage Family Study. Int J Obes Relat Metab Disord. 2002;26:789-796.
- Jacobs CA, Christensen CP, Karthikeyan T. Patient and intraoperative factors influencing satisfaction two to five years after primary total knee arthroplasty. J Arthroplasty. 2014;29(8):1576-1579.
- Johnston LD, Miech RA, O’Malley PM, Bachman JG, Schulenberg JE, Patrick ME. Monitoring the Future National Survey Results on Drug Use: 1975-2017: Overview, Key Findings on Adolescent Drug Use. Ann Arbor: Institute for Social Research, The University of Michigan; 2018.
- Joines JD, McNutt RA, Carey TS, Deyo RA, Rouhani R. Finding cancer in primary care outpatients with low back pain. J Gen Intern Med. 2001;16:14-23.
- Kaku DA, Lowenstein DH. Emergency of recreational drug abuse as a major risk factor for stroke in young adults. Ann Intern Med. 1990;113:821-827.
- Kalbfleisch JD, Prentice RL. The Statistical Analysis of Failure Time Data. 2nd ed. Hoboken, NJ: Wiley; 2002.
- Kasurinen A, Tervahartiala T, Laitinen A et al. High serum MMP-14 predicts worse survival in gastric cancer. PLoS One. 2018;13(12):e0208800.
- Katz MH. Multivariable Analysis. A Practical Guide for Clinicians. Cambridge, UK: Cambridge University Press; 1999.
- Katzan IL, Cebul RD, Husak SH, Dawson NV, Baker DW. The effect of pneumonia on mortality among patients hospitalized for acute stroke. Neurology. 2003;60:620-625.
- Kirk RE. Experimental Design: Procedures for the Behavioral Sciences. 3rd ed. Belmont, CA: Brooks/Cole; 1995.
- Kleinbaum DG. Survival Analysis: A Self-Learning Text. Berlin, Germany: Springer; 1996.
- Kleinbaum DG, Klein M. Logistic Regression: A Self-Learning Text. 3rd ed. Berlin. Germany: Springer; 2010.
- Kluess HA, Neidert LE, Wainright KS, Zheng C, Babu JR. Plasma dipeptidyl peptidase IV activity and measures of body composition in apparently healthy people. Dryad Digital Repository. 2016.
- Korn EL, Graubard Bl. Analysis of Health Surveys. Hoboken, NJ: Wiley; 1999.
- Kornak J et al. Nonlinear N-Score estimation for establishing cognitive norms from the National Alzheimer’s Coordinating Center dataset. Alzheimers Dement. 2018;14(7):390-391.
- Kreder HJ, Grosso P, Williams Jl et al. Provider volume and other predictors of outcome after total knee arthroplasty: a population study in Ontario. Can J Surg. 2003;46:15-22.
- Lamas GA, Pfeffer MA, Hamm P, Wertheimer J, Rouleau JL, Braunwald E. Do the results of randomized clinical trials of cardiovascular drugs influence medical practice? N Engl J Med. 1992;327:241-247.
- Lawrie GM, Morris GC, Earle N. Long-term results of coronary bypass surgery. Ann Surg. 1991;213:377-385.
- Lee ET, Wang JW. Statistical Methods for Survival Data Analysis. 3rd ed. Hoboken, NJ: Wiley; 2003.
- LeLorier K, Gregoire G, Benhaddad A, Lapierre J, Derderian F. Discrepancies between meta-analysis and subsequent large randomized, controlled trials. N Engl J Med. 1997;337:536-542.
- Leone MA, Raymkulova O, Lucenti A et al. A reliability study of colour-Doppler sonography for the diagnosis of chronic cerebrospinal venous insufficiency shows low inter-rater agreement. BMJ Ореп. 2013;3(11):e003508.
- Levinsky RJ, Malleson PN, Barratt TM, Soothill JF. Circulating immune complexes in steroid-responsive nephrotic syndrome. N Engl J Med. 1978;298:126-129.
- Levy PS, Lemeshow S. Sampling of Populations. Hoboken, NJ: Wiley; 1999.
- Li Y-C, Wang H-H, Ho C-H. Validity and reliability of the Mandarin version of Patient Dignity Inventory (PDI-MV) in cancer patients. PLoS One. 2018;13(9):e0203111.
- Lin C-Y, Lin T-H, Chen C-C, Chen M-C, Chen C-P. Combination chemotherapy with Regorafenib in metastatic colorectal cancer treatment: a single center, retrospective study. PLoS One. 2018;13(1):e0190497.
- Lissner L, Odell PM, D’Agostino RB et al. Variability of body weight and health outcomes in the Framingham population. N Engl J Med. 1991;324:1839-1844.
- Litwin M, Fink A. Survey Kit. 9 volumes. Thousand Oaks, CA: SAGE; 1995.
- Locket T. Evidence-Based and Cost-Effective Medicine for the Uninitiated. Oxford, UK: Radcliff Medical Press; 1997.
- Maisel AS, Krishnaswamy P, Nowak RM et al. Rapid measurement of B-type natriuretic peptide in the emergency diagnosis of heart failure. N Engl J Med. 2002;347:161-167.
- Marks RG, Dawson-Saunders EK, Bailar JC, Dan BB, Verran JA. Interactions between statisticians and biomedical journal editors. Stat Med. 1988;7:1003-1011.
- Martínez ME, Unkart JT, Tao Let al. Prognostic significance of marital status in breast cancer survival: a population-based study. PLoS One. 2017;12(5):e0175515.
- Marwick TH, Shaw LJ, Lauer MS et al. The noninvasive prediction of cardiac mortality in men and women with known or suspected coronary artery disease. Am J Med. 1999;106:172-178.
- Mazanec DJ. Low back pain syndromes. In: Black ER, Bordley DR, Tape TG, Panzer RJ Diagnostic Strategies for Common Medical Problems. 2nd ed. Philadelphia, PA: American College of Physicians; 1999: 401-418.
- McLean RR, Kiel DP, Berry SD et al. Lower lean mass measured by dual-energy x-ray absorptiometry (DXA) is not associated with increased risk of hip fracture in women: the Framingham Osteoporosis Study. Calcif Tissue Int. 2018.
- McMaster University Health Sciences Centre, Department of Clinical Epidemiology and Biostatistics: clinical disagreement, I: how it occurs and why. Can Med Assoc J. 1980a; 123:499-504.
- McMaster University Health Sciences Centre, Department of Clinical Epidemiology and Biostatistics: clinical Disagreement, II: how to avoid it and learn from it. Can Med Assoc J. 1980b;123:613-617.
- Meier P. The biggest public health experiment ever. In: Tanur JM, Pieters RS, Mosteller, eds. Statistics: A Guide to the Unknown. 3rd ed. Belmont, CA: Brooks/Cole; 1989.
- Moore M, Link-Gelles R, Schaffner W et al. Effectiveness of 13-valent pneumococcal conjugate vaccine for prevention of invasive pneumococcal disease in children in the USA: a matched case-control study. Lancet Respir Med. 2016;4(5):399-406.
- Moore JG, Bjorkman DJ, Mitchell MD, Avots-Avotins A. Age does not influence acute aspirin-induced gastric mucosal damage. Gastroenterology. 1991;100:1626-1629.
- Multiple Risk Factor Intervention Trial Research Group. Multiple risk factor intervention trial. JAMA. 1982;248:1465-1477.
- Murphy JL, Wootton SA, Bond SA, Jackson AA. Energy content of stools in normal healthy controls and patients with cystic fibrosis. Arch Dis Child. 1991;66:495-500.
- Neidert LE, Wainright KS, Zheng C, Babu JR, Kluess HA. Plasma dipeptidyl peptidase IV activity and measures of body composition in apparently healthy people. Heliyon. 2016;2(4):e00097.
- Newcombe RG. Two-sided confidence intervals for the single proportion: comparison of seven methods. Stat in Med. 1998;17:857-872.
- Nguyen CP, Adang EMM. Cost-effectiveness of breast cancer screening using mammography in Vietnamese women. PLoS One. 2018;13(3):e0194996.
- Norman GR, Streiner DL. PDQ Statistics. 2nd ed. Hamilton, Ontario: Decker; 1996.
- Ömeroglu H, Agus H, Biçimoglu A, Tümer Y. Analysis of a radiographic assessment method of acetabular cover in developmental dysplasia of the hip. Arch Orthop Trauma Surg. 2002;122:334-337.
- Poblador-Plou B, Calderón-Larrañaga A, Marta-Moreno J et al. Comorbidity of dementia: a cross-sectional study of primary care older patients. BMC Psychiatry. 2014;14(1):84.
- Pauker SG, Kassirer JP. The threshold approach to clinical decision making. N Engl J Med. 1980;302:1109-1117.
- Pauker SG, Kassirer JP. Decision analysis. N Engl J Med, 1987;316:250-258.
- Pearson ES, Hartley HO Biometrika Tables for Statisticians. Vol 1. 3rd ed. Cambridge, UK: Cambridge University Press; 1966.
- Pedhazur EJ. Multiple Regression in Behavioral Research. 3rd ed. New York, NY: Holt, Rinehart and Winston; 1997.
- Penzel R, Hoegel J, Schmitz W et al. Clusters of chromosomal imbalances in thymic epithelial tumours are associated with the WHO classification and the staging system according to Masaoka. Int J Cancer. 2003;105:494-498.
- Pereira AJ, Corrêa TD, de Almeida FP et al. Inaccuracy of venous point-of-care glucose measurements in critically ill patients: a cross-sectional study. PLoS One. 2015:10(6):e0129568.
- Peto R, Peto J. Asymptotically efficient rank invariant test procedures (with discussion). JR Stat Soc Series A. 1972;135:185-206.
- Poikolainen K, Reunala T, Karvonen J, Lauharanta J, Karkkainen P. Alcohol intake: a risk factor for psoriasis in young and middle aged men? BMJ. 1990;300:780-783.
- Priede A, Andreu Y, Martínez P, Conchado A, Ruiz-Torres M, González-Blanch C. The factor structure of the Medical Outcomes Study-Social Support Survey: a comparison of different models in a sample of recently diagnosed cancer patients. J Psychosom Res. 2018;108:32-38.
- Prigerson HG, Bao Y, Shah MA et al. Chemotherapy use, performance status, and quality of life at the end of life. JAMA Oncol. 2015;1(6):778-784.
- Quinn T, Moskowitz J, Khan MW et al. What families need and physicians deliver: contrasting communication preferences between surrogate decision-makers and physicians during outcome prognostication in critically ill TBI patients. Neurocrit Care. 2017;27:154.
- R Core Team. R: A Language and Environment for Statistical Computing. Vienna, Austria: R Foundation for Statistical Computing; 2019.
- Rabago CA, Dingwell JB, Wilken JM. Reliability and minimum detectable change of temporal-spatial, kinematic, and dynamic stability measures during perturbed gait. PLoS One. 2015;10(11):e0142083.
- Raiffa H. Decision Analysis. New York, NY: McGraw-Hill; 1997.
- Raurell-Torredà M, Olivet-Pujol J, Romero-Collado A et al. Case-based learning and simulation: useful tools to enhance nurses’ education? Nonrandomized controlled trial. J Nurs Scholarsh. 2014.
- Rea LM, Parker RA. Designing and Conducting Survey Research: A Comprehensive Guide. 2nd ed. San Francisco, CA: Jossey-Bass; 1997.
- Robbins R, Seixas A, Jean-Louis G et al. National patterns of physician management of sleep apnea and treatment among patients with hypertension. PLoS One. 2018;13(5):e0196981.
- Roethlisberger FJ, Dickson WJ, Wright HA. Management and the Worker. Cambridge, MA: Harvard Univ Press; 1946.
- Rogers WJ, Coggin CJ, Gersh BJ et al. Ten-year follow-up of quality of life in patients randomized to receive medical therapy or coronary artery bypass graft surgery. The Coronary Artery Surgery Study. Circulation. 1990;82:1647-1658.
- Rogers LQ, Bailey JE, Gutin B et al. Teaching resident physicians to provide exercise counseling: a needs assessment. Acad Med. 2002;77:841-844.
- Rubin DB. Estimating causal effects from large data sets using propensity scores. Ann Intern Med. 1997;127:757-763.
- Rubin P Clinical Oncology: A Multidisciplinary Approach. 6th ed. Atlanta, GA: American Cancer Society; 1983.
- Sackett DL. Bias in analytic research. J Chronic Dis. 1979;32:51-63.
- Sackett DL, Haynes RB, Tugwell P. Clinical Epidemiology: A Basic Science for Clinical Medicine. 2nd ed. London, UK: Little, Brown Book Group; 1991.
- Sacks HS, Berrier J, Reitman D, Ancona-Berk VA, Chalmers TC. Meta-analysis of randomized controlled trials. N Engl J Med. 1987;316:450-455.
- Sgarbossa EB, Pinski SL, Barbagelata A et al. Electrocardiographic diagnosis of evolving acute myocardial infarction in the presence of left bundle-branch block. N Engl J Med. 1996;334:481-487.
- Schlesselman JJ. Case-Control Studies: Design, Conduct, Analysis. Oxford, UK: Oxford University Press; 1982.
- Sekiya N, Nagasaki H. Reproducibility of the walking patterns of normal young adults: test-retest reliability of the walk ratio (step-length/step-rate). Gait & Posture. 1998;7(3): 225-227.
- Serrano CW, Wright JW, Newton ER. Surgical glove perforation in obstetrics. Obstet Gynecol. 1991;77:525-528.
- Shah AC, Ma K, Faraoni D, Oh DCS, Rooke GA, Van Norman GA. Self-reported functional status predicts post-operative outcomes in non-cardiac surgery patients with pulmonary hypertension. PLoS One. 2018;13(8):e0201914.
- Shipley WU, Seiferheld W, Lukka HR et al. Radiation with or without Antiandrogen Therapy in Recurrent Prostate Cancer. N Engl J Med. 2017;376(5):417-428.
- Shlipak MG, Lyons WL, Go AS, Chou TM, Evans GT, Browner WS. Should the electrocardiogram be used to guide therapy for patients with left bundle-branch block and suspected myocardial infarction? JAMA. 1999;281:714-719.
- Snedecor GW, Cochran WG. Statistical Methods. 8th ed. Ames, IA: Iowa State University Press; 1989.
- Springer. Common Reasons for Rejection. 2018.
- St Sauver JL, Boyd CM, Grossardt BR et al. Risk of developing multimorbidity across all ages in an historical cohort study: differences by sex and ethnicity BMJ Open 2015;5:e006413.
- Steering Committee of the Physicians’ Health Study Research Group. Final report on the aspirin component of the ongoing Physicians’ Health Study. N Engl J Med. 1989;321:129-135.
- Stewart AL, Hays RD, Ware JE Jr. The MOS short-form general health survey. Med Care. 1988;26:724-735.
- Stoline MR. The status of multiple comparisons: simultaneous estimation of all pairwise comparisons in one-way ANOVA designs. Am Stat. 1981:35:134-141.
- Ström M, Uckelstam C, Andersson G, Hassmén P, Umefjord G, Carlbring P. Internet-delivered therapist-guided physical activity for mild to moderate depression: A randomized controlled trial. PeerJ. 2013;1:e178.
- Stuart P, Malick F, Nair RP et al. Analysis of phenotypic variation in psoriasis as a function of age at onset and family history. Arch Dermatol Res. 2002;294:207-213.
- Tan EM, Cohen AS, Fries JF et al. The 1982 revised criteria for the classification of systemic lupus erythematosus. Arthritis Rheum. 1982;25:1271-1277.
- Tarlov AR, Ware JE Jr, Greenfield S, Nelson EC, Perrin E, Zubkoff M. The Medical Outcomes Study: an application of methods for monitoring the results of medical care. JAMA. 1989;262:925-930.
- Thiese MS, Arnold ZC, Walker SD. The misuse and abuse of statistics in biomedical research. Biochemia Medica. 2015;25(1):5-11.
- Thompson IM, Goodman PJ, Tangen CM et al. The influence of finasteride on the development of prostate cancer. N Engl J Med. 2003;349:213-222.
- Tukey J. Exploratory Data Analysis. Boston, MA: Addision-Wesley; 1977.
- van Crevel H, Habbema JDF, Braakman R. Decision analysis of the management of incidental intracranial saccular aneurysms. Neurology. 1986;36:1335-1339.
- van Eersel MEA, Joosten H, Gansevoort RT et al. Treatable vascular risk and cognitive performance in persons aged 35 years or older: longitudinal study of six years. J Prev Alzheimers Dis. 2019;6:42.
- van Lindert EJ, Bilsen MV, Flier MVD, Kolwijck E, Delye H, Oever JT. Topical vancomycin reduces the cerebrospinal fluid shunt infection rate: a retrospective cohort study. PLoS ONe. 2018;13(1):e0190249.
- Walker H. Studies in the History of Statistical Method. Philadelphia, PA: Lippincott, Williams & Wilkins; 1931.
- Ware C. Information Visualization: Perception for Design. Waltham, MA: Morgan Kaufman; 2013.
- Ware JE, Brook RH, Rogers WH et al. Health Outcomes for Adults in Prepaid and Fee-for-service Systems of Care. Santa Monica, CA: The RAND Corporation; 1987.
- Wasserstein RL, Lazar NA. The ASA’s Statement on p-Values: context, Process, and Purpose. American Statistician. 2016;70(2):129-133.
- Weiner DK, Rudy TE. Attitudinal barriers to effective treatment of persistent pain in nursing home residents. J Am Geriatr Soc. 2002;50:2035-2040.
- Weingarten SR, Stone E, Green A et al. A study of patient satisfaction and adherence to preventive care practice guidelines. Am J Med. 1995;99:590-596.
- Weinstein JN. Clinical crossroads: a 45-year-old man with low back pain and a numb left foot. JAMA. 1998;280:730-736.
- Weinstein MC, Fineberg HV. Clinical Decision Analysis. Philadelphia, PA: WB Saunders; 1998.
- Xu JQ, Murphy SL, Kochanek KD, Bastian B, Arias E. Deaths: Final data for 2016. National Vital Statistics Reports; vol 67 no 5. Hyattsville, MD: National Center for Health Statistics; 2018.
- Zamboni P, Morovic S, Menegatti E et al. Screening for chronic cerebrospinal venous insufficiency (CCSVI) using ultrasound-recommendations for a protocol Int Angiol. 2011;30:571-97.
- Bailar JC, Mosteller F Medical Uses of Statistics. 2nd ed. Waltham, MA: Massachusetts Medical Society; 1992.
- Briscoe MH. Preparing Scientific Illustrations: A Guide to Better Posters, Presentations, and Publications. 2nd ed. Berlin, Germany: Springer-Verlag; 1996.
- Cummings SM, Savitz LA, Konrad TR. Reported response rates to mailed physician questionnaires. Health Ser Res. 2001;35:1347-1355.
- Kleinbaum DG, Kupper LL, Muller KE, Nizam A, Kleinbaum DG, Nizati A. Applied Regression Analysis and Other Multivariable Methods. 3rd ed. California, CA: Duxbury Press; 1997.
- Spirer HF, Spirer L, Jaffe AJ. Misused Statistics. New York, NY: Marcel Dekker; 1998.
- Wainer H. How to display data badly. Am Stat. 1984;38:137-147.
- Wainer H. Understanding graphs and tables. Educ Researcher. 1992;21:14-23.